. 2021 Jul 12;10:e66396. doi: 10.7554/eLife.66396

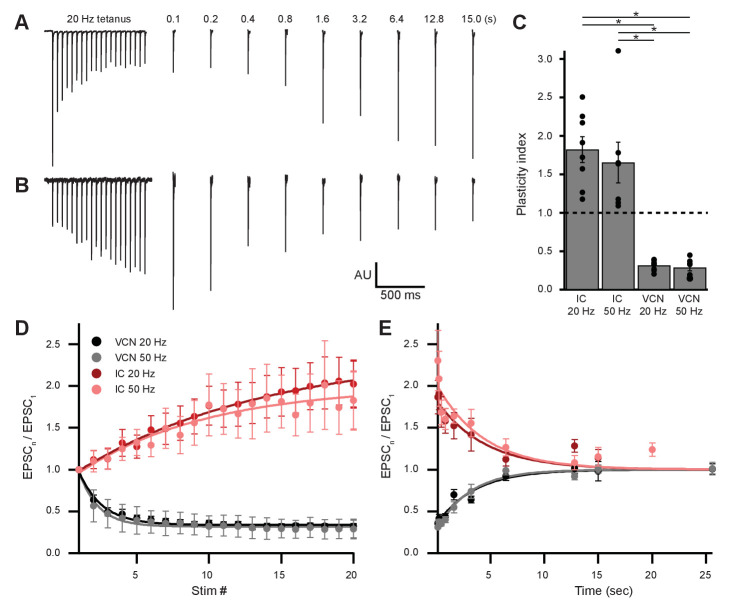
Figure 7. Ascending and descending inputs to medial olivocochlear neurons showed distinct short-term plasticity.

(A, B) Light-evoked EPSCs originating from ventral cochlear nucleus (VCN) (A) or inferior colliculus (IC) (B) input. During a 20-Hz tetanus stimulus, VCN-originating EPSCs depressed, whereas IC-originating EPSCs facilitated. After each 20-pulse tetanus, a test EPSC was evoked at time intervals increasing from 100 ms to 25.6 s. Each average test EPSC was normalized to the first EPSC of the respective tetanus stimulus. (C) ‘Plasticity index’ to illustrate the degree of facilitation or depression. The index for IC input was the ratio of the amplitude of the last three EPSCs of the tetanus over the amplitude of the first three EPSCs. The index for VCN input was the ratio of the amplitude of the last three EPSCs over the amplitude of the first EPSC of the tetanus. There was no significant difference between 20 Hz and 50 Hz stimulation between inputs of the same origin; however, all IC input was significantly different to all VCN input (p = 4.0 × 10⁻⁷ at 20 Hz and p = 2.7 × 10⁻⁴ at 50 Hz; two-way analysis of variance (ANOVA) with post-hoc Tukey test). Error bars are ± SEM. (D) Ascending VCN input depresses in amplitude during a tetanus stimulation at both 20 Hz and 50 Hz (20 pulses), while descending IC input facilitates. The average normalized EPSC during a tetanus stimulation is shown for both VCN (N=7, 50 Hz; N=8, 20 Hz) and IC (N=7, 50 Hz; N=8, 20 Hz) inputs. (E) Depression observed by ascending VCN input (τ20Hz = 3.5 ± 0.7 s, τ50Hz = 3.1 ± 0.4 s) recovered with a similar time course to IC input facilitation (τ20Hz = 4.5 ± 1.4 s, τ50Hz = 4.4 ± 1.7 s).

Figure 7.

Figure 7—figure supplement 1. Short-term plasticity from VCN and IC inputs onto medial olivocochlear neurons was observed with axonal and terminal level light stimulation.

Figure 7—figure supplement 1.

(A) Schematic illustrating the positioning of a X40 objective lens at varying distances with respect to a recording pipette attached to an medial olivocochlear (MOC) neuron (not to scale). For both ventral cochlear nucleus (VCN) and inferior colliculus (IC) inputs, the objective lens was moved either toward or away from the IC in 230 µm increments. It was assumed that axonal stimulation of IC input resulted in orthodromic activation, while axonal stimulation of VCN input resulted in antidromic activation, as VCN-originating T-stellate neurons project to the IC, further confirming that T-stellate neurons make functional depressing synapses onto MOC neurons. (B) Example traces of EPSCs evoked from activating IC inputs at varying distances from the recording pipette. Numbers −1 through 5 correspond to the objective positions illustrated in panel (A). As the objective lens was moved further from the recording location, EPSC onset was delayed. The EPSC amplitude often reduced, likely due to a lower probability of intact fibers at distances farther from the recording site. Each trace was an average of 20 sweeps, low-pass Bessel filtered at 3000 Hz, and baselined to 0 pA. (C) A plot showing the increase in delay from the first EPSC with increasing distance from the recorded MOC neuron. The ‘onset’ of each EPSC was measured at −5 pA from baseline. Data from IC and VCN were not significantly different and the data were combined (N = 9 at 0 through 690 µm, N = 8 at 920 µm, and N = 5 at 1150 µm). Axon velocity was determined from the slope of a linear fit of the mean data (y=0.00175*x-0.3844,r2=0.989). Error bars are ± SEM. (D) Light stimulation of VCN or IC inputs at varying distances from the recorded MOC neuron had no effect on short-term depression or facilitation, respectively (for IC input, N = 4 at 0 through 690 µm, N = 3 at 920 through 1150 µm; for VCN input, N = 5 at 0 through 920 µm, N = 2 at 1150 µm). Error bars are ± SEM.