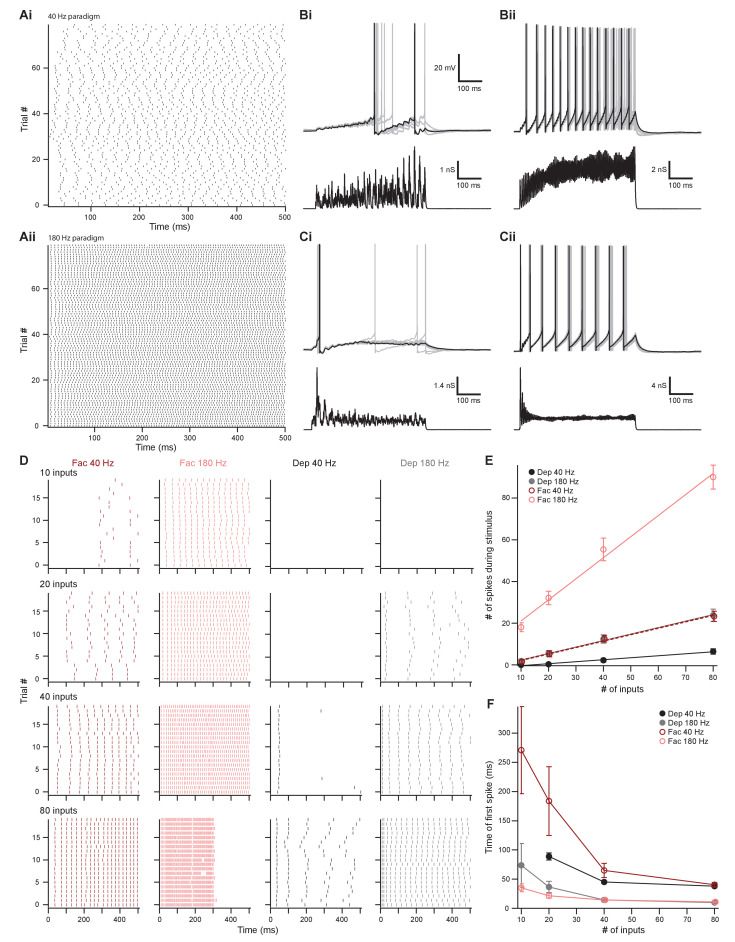
Figure 8. The number of presynaptic inputs and type of short-term plasticity control the dynamic range and onset timing of MOC neuron output.
(A) Raster plots of presynaptic excitatory postsynaptic conductance (EPSG) onset timing. The ~40 Hz paradigm (Ai) had an average rate of 41.1 ± 0.5 Hz for all 80 trials. The ~180 Hz paradigm (Aii) had an average rate of 176 ± 1 Hz for all 80 trials. Each trial was considered a presynaptic input in our model. (B) Ten example traces of membrane voltage responses to injected conductance waveforms simulating 10 inputs at ~40 Hz (Bi) or ~180 Hz (Bii) that underwent short-term facilitation. Scale bar is the same for all voltage responses in (B) and (C). (C) Ten example traces of membrane voltage responses to injected conductance waveforms simulating 40 inputs at ~40 Hz (Ci) or ~180 Hz (Cii) that underwent short-term depression. (D) Example raster plots of postsynaptic medial olivocochlear (MOC) neuron action potential timing in response to injected conductance waveforms. Rows of raster plots correspond to the number of simulated inputs, and columns correspond to the type of simulated presynaptic short-term plasticity and firing rate. Blank raster plots represent an absence of firing. One example (80 presynaptic inputs at ~180 Hz with short-term facilitation) underwent depolarization block after ~300 ms. All examples are from the same MOC neuron. (E) Average total number of action potentials evoked in MOC neurons (N = 6) during each conductance waveform paradigm. Error bars are ± SEM. (F) Average timing of the peak of the first action potential evoked in MOC neurons (N = 6) during each conductance waveform paradigm. Error bars are ± SEM.
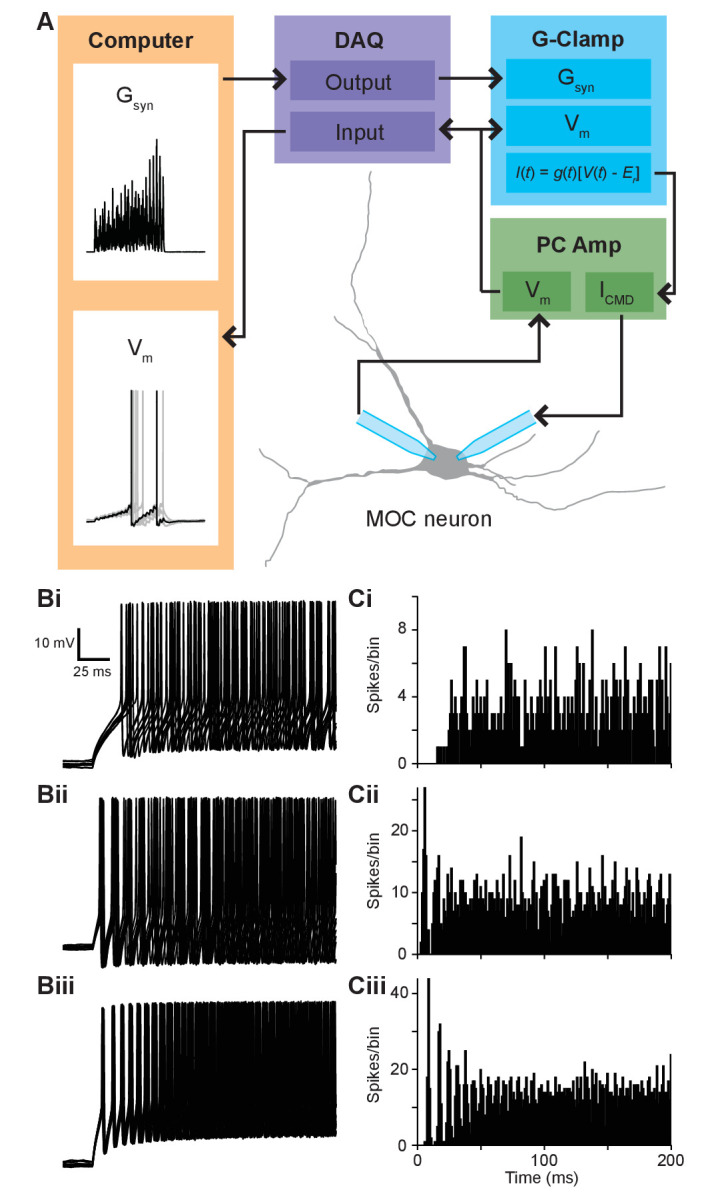
Figure 8—figure supplement 1. Synaptic conductance waveforms were modeled after physiological data.


