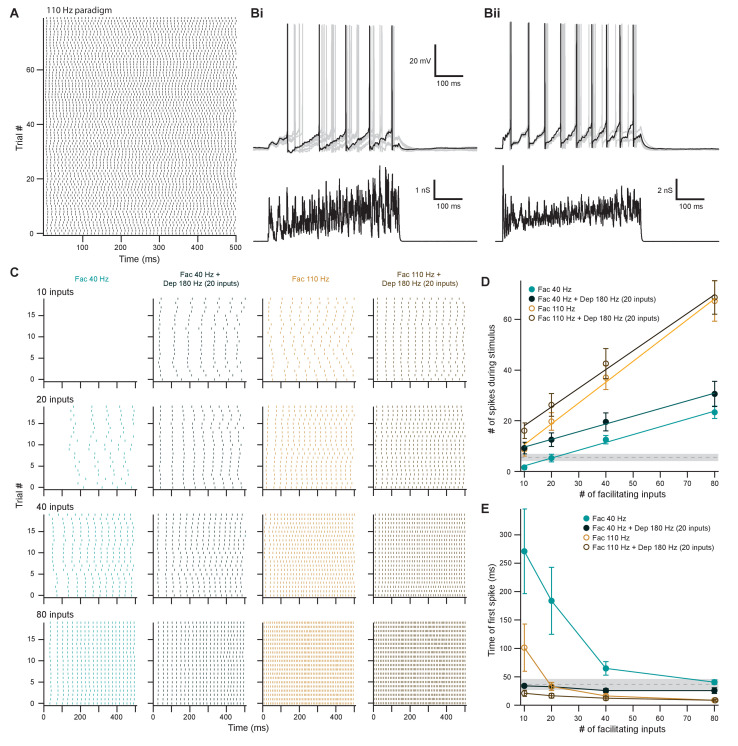
Figure 9. Facilitating inputs to MOC neurons can override or be enhanced by depressing inputs, depending on their number and rate.
(A) Raster plot of presynaptic excitatory postsynaptic conductance (EPSG) onset timing for the ~110 Hz paradigm, which had an average rate of 111 ± 1 Hz for all 80 trials. Each trial was considered a presynaptic input in our model. (B) Ten example traces of membrane voltage responses to injected conductance waveforms simulating 20 facilitating inputs at ~40 Hz without (Bi) or with (Bii) the addition of 20 depressing inputs at ~180 Hz. Scale bar is the same for both voltage responses. (C) Example raster plots of postsynaptic medial olivocochlear (MOC) neuron action potential timing in response to injected conductance waveforms, without (even columns) or with (odd columns) the addition of 20 depressing inputs at ~180 Hz. Rows of raster plots correspond to the number of simulated inputs, and columns correspond to the type of simulated presynaptic short-term plasticity and firing rate. Blank raster plots represent an absence of firing. All examples are from the same MOC neuron. (D) Average total number of action potentials evoked in MOC neurons (N = 5) during each conductance waveform paradigm. Error bars are ± SEM. Gray dashed line represents 20 depressing inputs at ~180 Hz, and the shaded area represents ± SEM in (D) and (E). (E) Average timing of the peak of the first action potential evoked in MOC neurons (N = 5) during each conductance waveform paradigm. Error bars are ± SEM.

