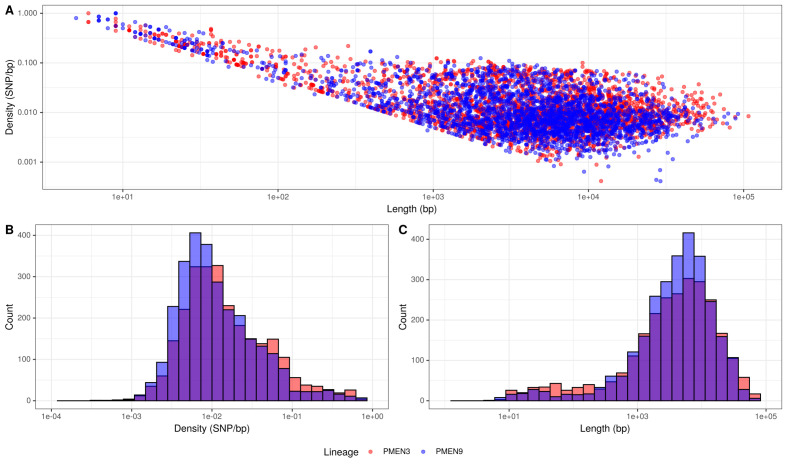
Figure 3. Summary of recombination differences between the PMEN3 and PMEN9 lineages.
(A) Plotting the SNP density of recombination events relative to their length across both lineages. Dots represent individual recombination events and are colored by the lineage in which they were inferred. (B) Overlaid histograms of the SNP densities of recombination events across PMEN3 and PMEN9. (C) Overlaid histograms of the length, in bases, of each recombination event across PMEN3 and PMEN9.

