. 2021 Jul 14;10:e67113. doi: 10.7554/eLife.67113

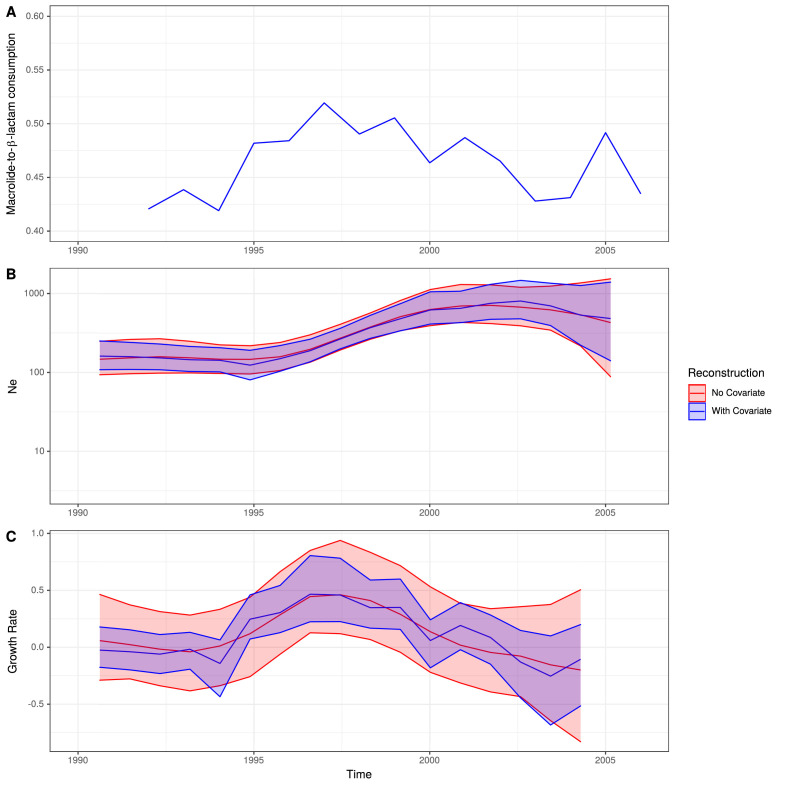
Figure 5. Expansion of a macrolide-resistant clade in Germany prior to vaccine introduction.

(A) The ratio of macrolide-to-β-lactam consumption in Germany. (B) The change in Ne through time inferred by Skygrowth, with the red line showing the results of the analysis that did not include covariates, and the blue line showing the results of the analysis that incorporated the macrolide-to-β-lactam ratio into the phylodynamic reconstruction. Shaded regions represent the 95% credible intervals. (C) The reconstruction of the growth rate of Ne through time. The red line represents the result of model fitting without covariates, and the blue line when the macrolide-to-β-lactam ratio data were incorporated. Shaded regions represent the 95% credible interval for the reconstruction. 

Figure 5.

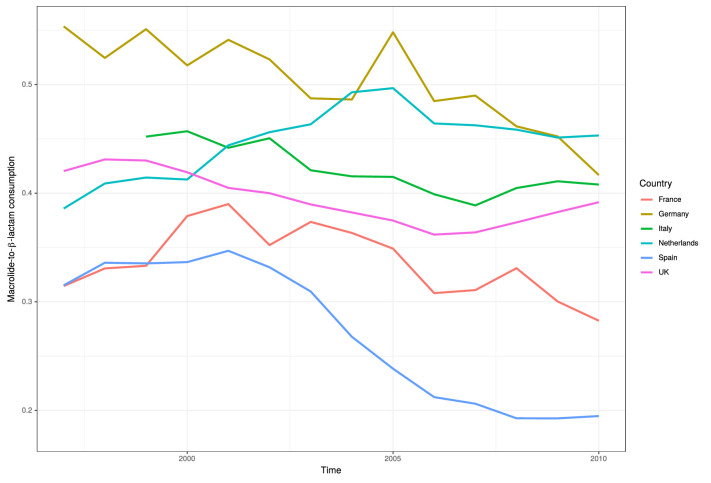
Figure 5—figure supplement 1. Ratio of macrolide-to-β-lactam consumption in Europe.

Figure 5—figure supplement 1.

The ratios of macrolide use, in DDD, for β-lactam use for six major European countries between 1997 and 2010.
Figure 5—figure supplement 2. Root-to-tip analysis of 162 German isolates within PMEN9.

Figure 5—figure supplement 2.

(A) The 162-isolate phylogeny with node tips colored by date of isolation. (B) Linear regression of root-to-tip distance against sampling date for isolates.
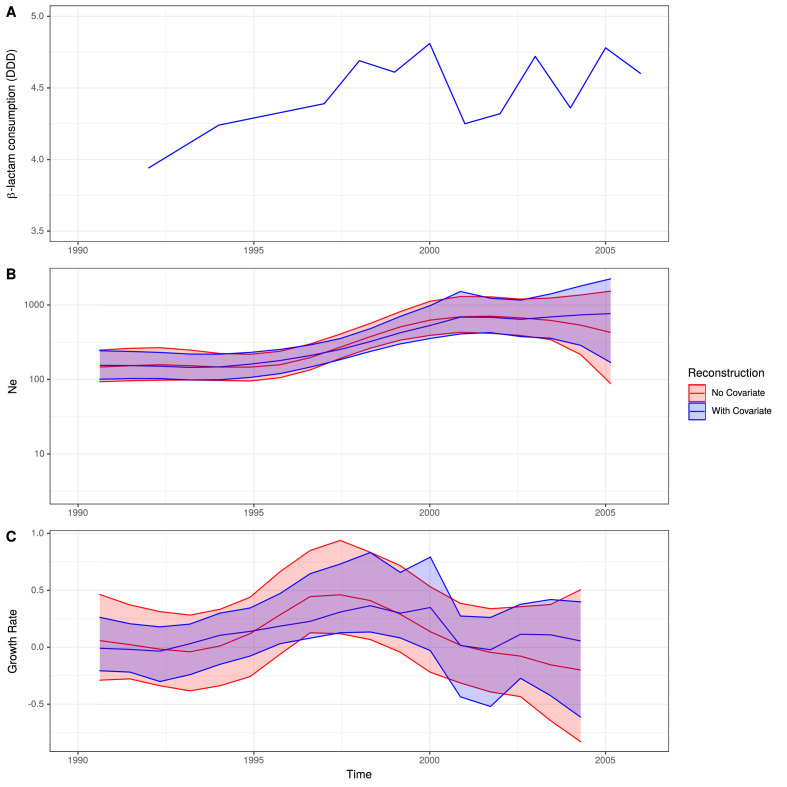
Figure 5—figure supplement 3. Skygrowth analysis incorporating β-lactam consumption data.

Figure 5—figure supplement 3.

(A) The rate of β-lactam consumption in Germany in DDD. (B) The change in Ne through time inferred by Sygrowth, with the red line showing the results when no covariates were incorporated, and the blue line showing the equivalent results when β-lactam consumption data were incorporated into the reconstruction. Shaded regions represent the 95% credible intervals. (C) The reconstruction of the growth rate of Ne through time. The red line represents the result of model fitting without covariates, and the blue line shows the results when β-lactam consumption data were incorporated. Shaded regions represent the 95% credible intervals for the reconstructions.
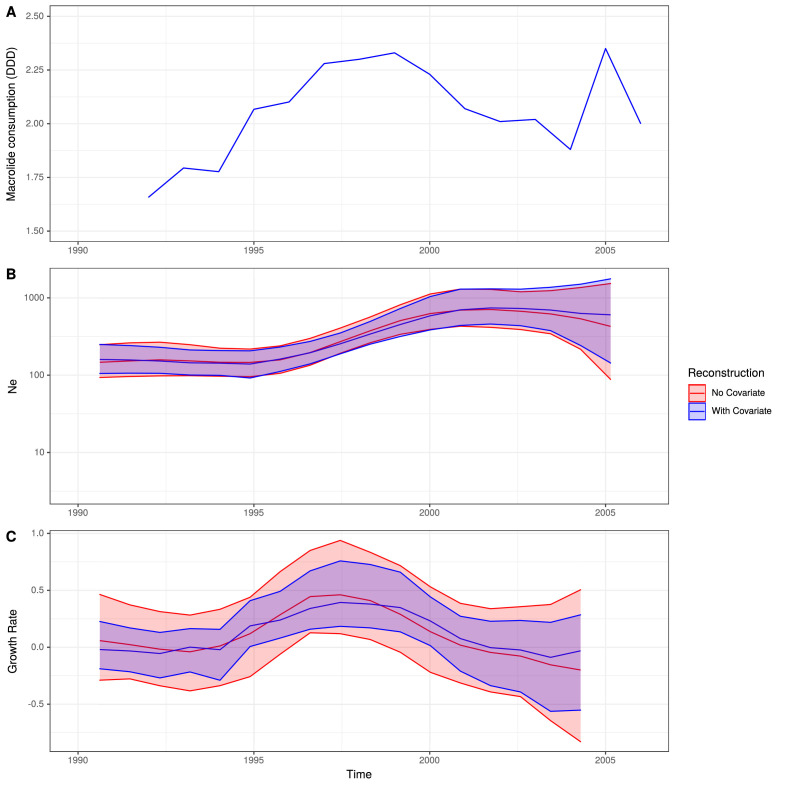
Figure 5—figure supplement 4. Skygrowth analysis incorporating macrolide consumption data.

Figure 5—figure supplement 4.

(A) The rate of macrolide consumption in Germany in DDD. (B) The change in Ne through time inferred by Skygrowth, with the red line representative of when no covariates were incorporated into the reconstruction and the blue line when the macrolide conusmption data were incorporated into the reconstruction. Shaded regions represent the 95% credible intervals. (C) The reconstruction of the growth rate of Ne through time. The red line represents the result of model fitting without covariates, and the blue line shows the results when the macrolide consumption data were incorporated. Shaded regions represents the 95% credible interval for the reconstructions.
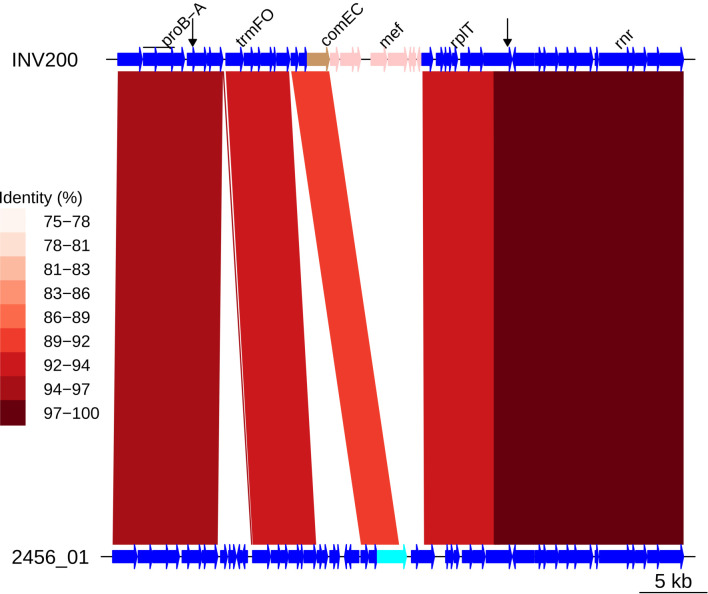
Figure 5—figure supplement 5. Insertion of Tn1207.1 within PMEN9 reference genome.

Figure 5—figure supplement 5.

Comparison of the Tn1207.1 element insertion, highlighted in pink within the INV200 genome, with the orthologous unmodified locus in sample 2456_01. The red bands between the genomes represent sequence matches identified by BLASTN. These bars are shaded by the percentage identity between the sequences. The intact comEC gene is colored cyan within 2456_01, where the fragments of this gene generated by the Tn1207.1 insertion are colored brown in INV200. Arrows along the INV200 genome mark the start and end of the recombination event inferred to have imported Tn1207.1 by the phylogenetic analyses.