. 2021 Jul 29;10:e56265. doi: 10.7554/eLife.56265

Figure 1. Emergent property inference in the stomatogastric ganglion.

(A) Conductance-based subcircuit model of the STG. (B) Spiking frequency ω(𝐱;𝐳) is an emergent property statistic. Simulated at gel=4.5 nS and gsynA=3 nS. (C) The emergent property of intermediate hub frequency. Simulated activity traces are colored by log probability of generating parameters in the EPI distribution (Panel E). (D) For a choice of circuit model and emergent property, EPI learns a deep probability distribution of parameters 𝐳. (E) The EPI distribution producing intermediate hub frequency. Samples are colored by log probability density. Contours of hub neuron frequency error are shown at levels of 0.525, 0.53, … 0.575 Hz (dark to light gray away from mean). Dimension of sensitivity 𝐯1 (solid arrow) and robustness 𝐯2 (dashed arrow). (F) (Top) The predictions of the EPI distribution. The black and gray dashed lines show the mean and two standard deviations according the emergent property. (Bottom) Simulations at the starred parameter values.

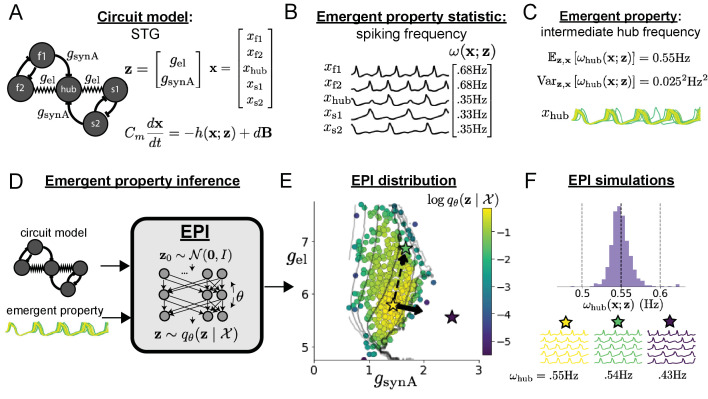
Figure 1.

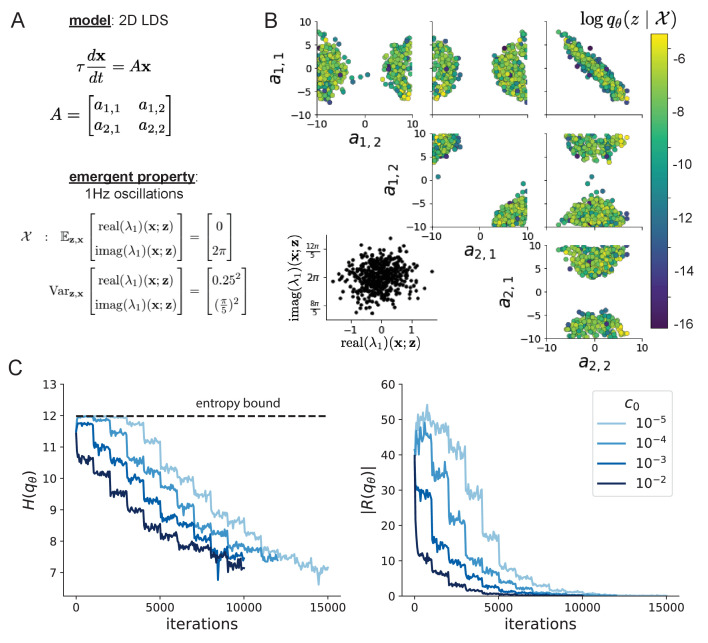
Figure 1—figure supplement 1. Emergent property inference in a 2D linear dynamical system.

Figure 1—figure supplement 1.

(A) Two-dimensional linear dynamical system model, where real entries of the dynamics matrix A are the parameters. (B) The EPI distribution for a two-dimensional linear dynamical system with τ=1 that produces an average of 1 Hz oscillations with some small amount of variance. Dashed lines indicate the parameter axes. (C) Entropy throughout the optimization. At the beginning of each augmented lagrangian epoch (imax=2,000 iterations), the entropy dipped due to the shifted optimization manifold where emergent property constraint satisfaction is increasingly weighted. (D) Emergent property moments throughout optimization. At the beginning of each augmented lagrangian epoch, the emergent property moments adjust closer to their constraints.
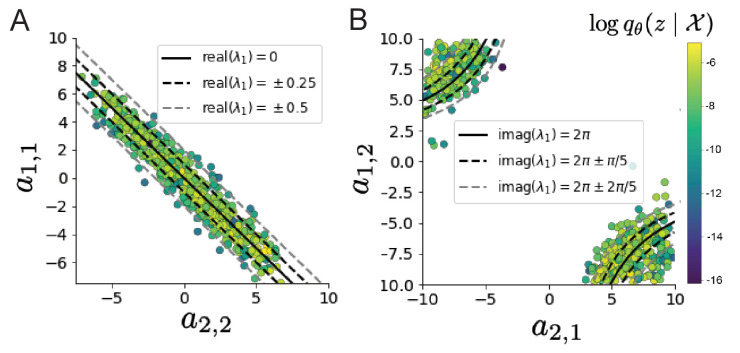
Figure 1—figure supplement 2. Analytic contours of inferred EPI distribution.

Figure 1—figure supplement 2.

(A) Probability contours in the a1,1-a2,2 plane were derived from the relationship to emergent property statistic of growth/decay factor real(λ1). (B) Probability contours in the a1,2-a2,1 plane were derived from the emergent property statistic of oscillation frequency 2πimag(λ1).
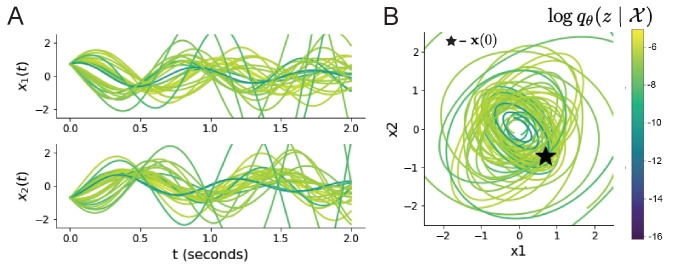
Figure 1—figure supplement 3. Sampled dynamical systems 𝐳q𝜽(𝐳𝒳) and their simulated activity from 𝐱(t=0)=[22,-22] colored by log probability.

Figure 1—figure supplement 3.

(A) Each dimension of the simulated trajectories throughout time. (B) The simulated trajectories in phase space.
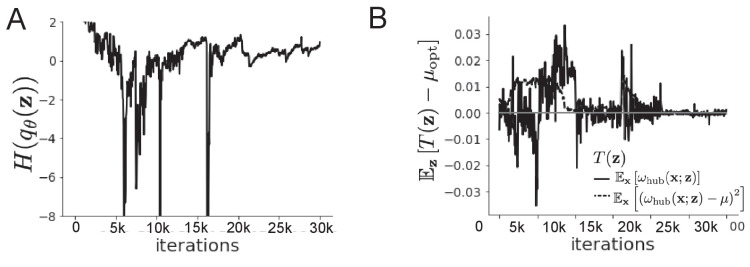
Figure 1—figure supplement 4. EPI optimization of the STG model producing network syncing.

Figure 1—figure supplement 4.

(A) Entropy throughout optimization. (B) The emergent property statistic means and variances converge to their constraints at 25,000 iterations following the fifth augmented lagrangian epoch.