. 2021 Jul 29;10:e64092. doi: 10.7554/eLife.64092

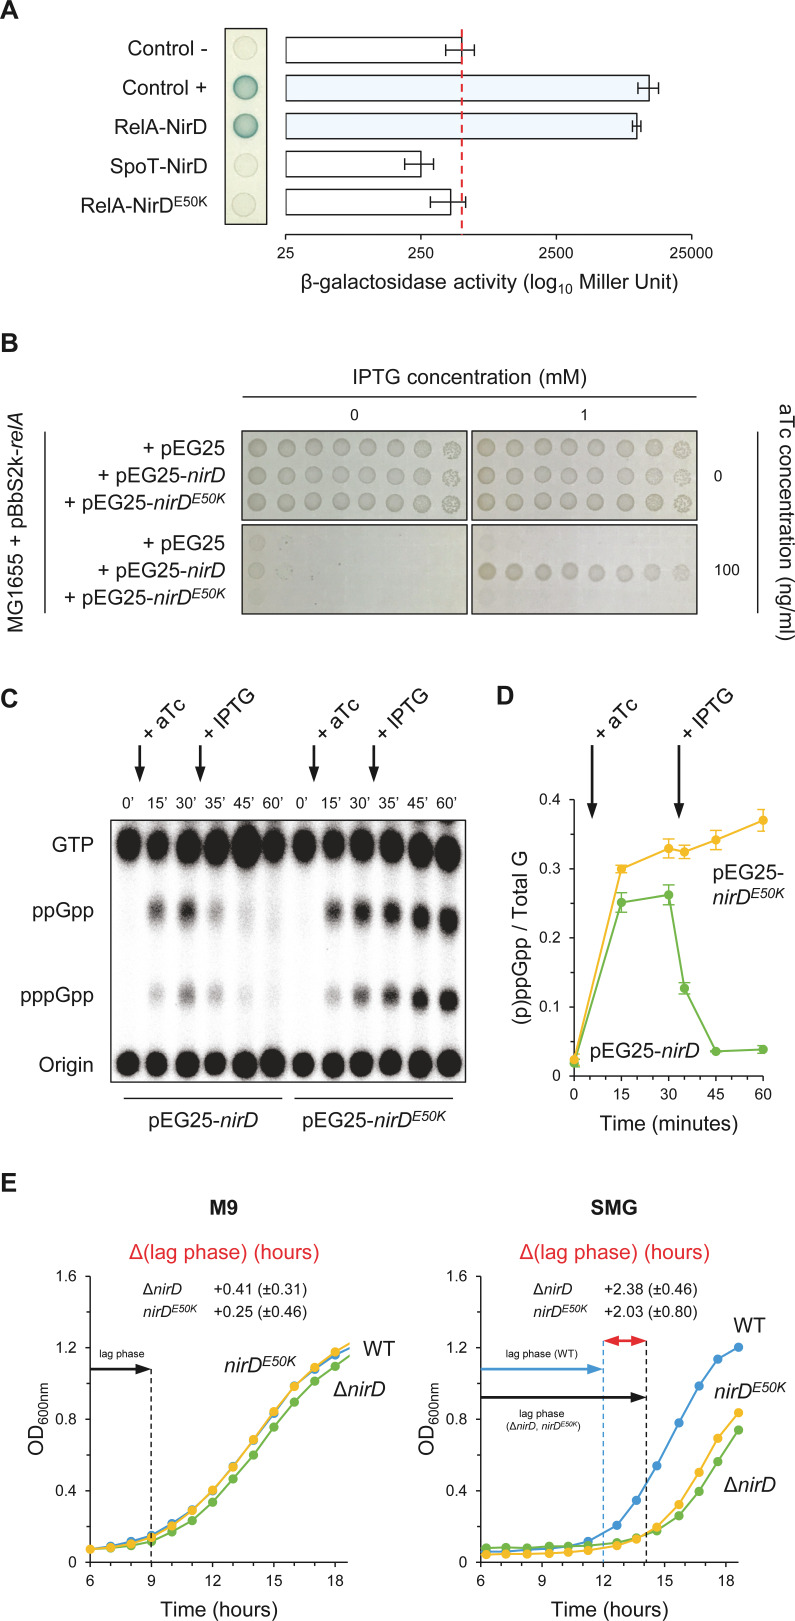
Figure 3. NirD can inhibit RelA-dependent accumulation through physical interaction in vivo.

(A) Bacterial two-hybrid assay using E. coli BTH101 cells co-transformed with plasmid derivatives pKT25-relA or pKT25-spoT and pUT18C-nirD or pUT18C-nirDE50K. Stationary-phase cultures were spotted on NA plates containing X-Gal as a blue color reporter for positive interaction. The bars showing β-galactosidase activity are represented as the means of three independent experiments, and the error bars depict the SDs. (B) Growth assay of E. coli MG1655 cells co-transformed with the plasmid derivatives pBbS2k-relA and pEG25-nirD or pEG25-nirDE50K inducible by anhydrotetracycline (aTc) and isopropyl β-D-1-thiogalactopyranoside (IPTG), respectively. Serial dilutions of stationary-phase cultures were spotted on NA plates containing the indicated concentrations of inducers. The results are representative of three independent experiments. (C, D) In vivo (p)ppGpp level dynamic in E. coli MG1655 cells carrying pBbS2k-relA and pEG25-nirD or pEG25-nirDE50K after successive inductions of expression of the relA and nirD or nirDE50K genes using 100 ng/mL aTc and 1 mM IPTG, respectively. Nucleotides extracted from samples collected at the indicated times were separated by thin layer chromatography. The autoradiogram (C) is representative of three independent experiments, and the curves of the relative levels of (p)ppGpp (D) are represented as the means of the three independent experiments, the error bars depicting the SDs. (E) Growth curves of wild-type (WT) cells, ΔnirD, and nirDE50K mutants under anaerobiosis in M9-glucose minimal medium without amino acids (left panel) or supplemented with 1 mM serine, methionine, and glycine (SMG) (right panel) (see Materials and methods). The growth curves are representative of at least three independent experiments, and the Δ(lag phase) are represented as the means (± SD) of the independent experiments.

Figure 3—source data 1. Determination of β-galactosidase activity.
The relative β-galactosidase activity was calculated as follows:1000×Slope(ΔOD420nmΔt)V×OD600nm. Slope is estimated by linear regression, and V is the volume of culture used (in mL). The source data are provided for the bar chart showing β-galactosidase activity in Figure 3A, which is represented as the means and SDs of three independent experiments.
Figure 3—source data 2. Raw autoradiogram.
Figure 3—source data 3. Quantification of (p)ppGpp.
The amount of (p)ppGpp was normalized to total amount of G nucleotides observed in each sample. Total G is the sum of GTP and (p)ppGpp detected. The source data are provided for the relative levels of (p)ppGpp in Figure 3D, which are represented as the means and SDs of three independent experiments.
Figure 3—source data 4. Determination of Δ(lag phase).
The Δ(lag phase) corresponds to the time that separates the growth recovery of the wild-type (WT) (lag phase [WT]) from that of the ΔnirD or nirDE50K (lag phase [ΔnirD, nirDE50K]). For each strain, the duration of the lag phase was calculated for an OD600nm corresponding to the entry into the exponential growth phase. The equation for this calculation was estimated by linear regression on the log phase of each growth curve. The source data are provided for the Δ(lag phase) in Figure 3E, which are represented as the means and SDs of at least three experiments.

Figure 3.

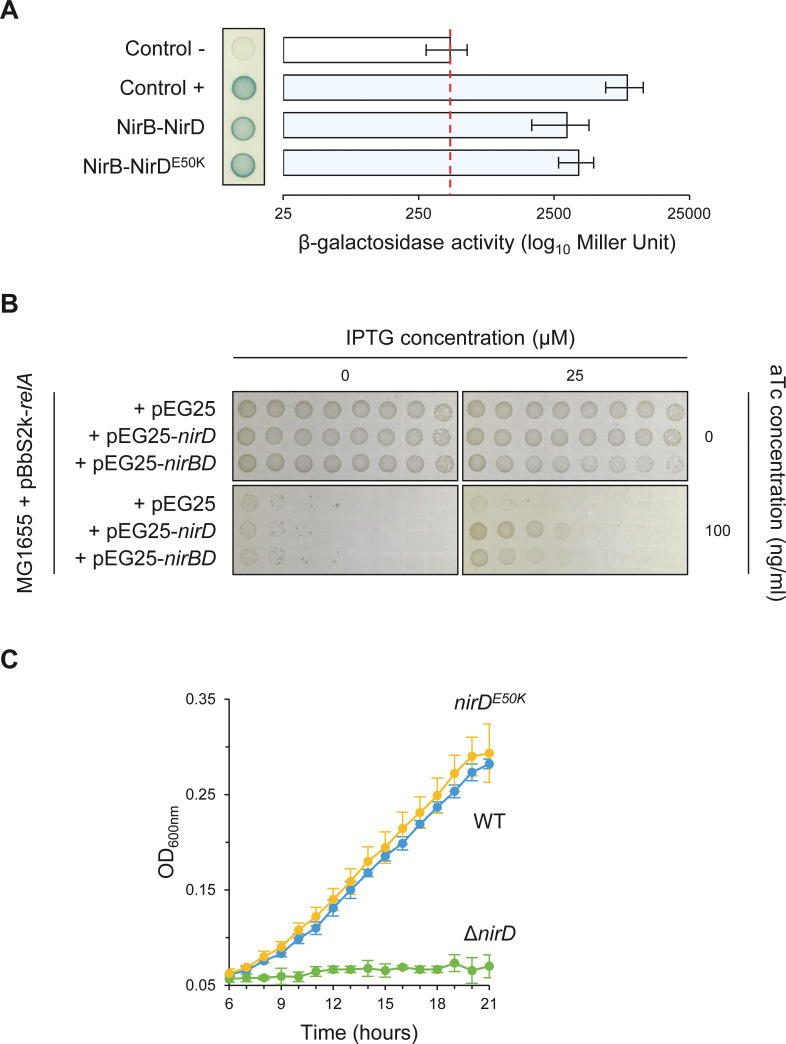
Figure 3—figure supplement 1. NirDE50K functionally interacts with NirB.

Figure 3—figure supplement 1.

(A) Bacterial two-hybrid assay using E. coli BTH101 cells co-transformed with plasmid derivatives pKT25-nirB and pUT18C-nirD or pUT18C-nirDE50K. Stationary-phase cultures were spotted on NA plates containing X-Gal as a blue color reporter for positive interaction. The bars showing β-galactosidase activity are represented as the means of three independent experiments, and the error bars depict the SDs. (B) Growth assay of E. coli MG1655 cells co-transformed with the plasmid derivatives pBbS2k-relA and pEG25-nirD or pEG25-nirBD inducible by anhydrotetracycline (aTc) and isopropyl β-D-1-thiogalactopyranoside (IPTG), respectively. Serial dilutions of stationary-phase cultures were spotted on NA plates containing the indicated concentrations of inducers. The results are representative of three independent experiments. (C) Growth curves of wild-type (WT) cells, ΔnirD, and nirDE50K mutants under anaerobiosis in defined glycerol minimal medium supplemented with nitrate as the sole electron acceptor and as the sole nitrogen source (see Materials and methods). Under nitrate respiration, nitrate is converted to nitrite, which is subsequently converted to ammonium (NH4) by the cytosolic NADH-dependent nitrite reductase NirBD. Bacteria can then utilize NH4 as nitrogen source. Therefore, an active NADH-dependent nitrite reductase activity is required for anaerobic growth when nitrate is the sole nitrogen source (Wang et al., 2019b).
Figure 3—figure supplement 1—source data 1. Determination of β-galactosidase activity.
The relative β-galactosidase activity was calculated as follows:1000×Slope(ΔOD420nmΔt)V×OD600nm. Slope is estimated by linear regression, and V is the volume of culture used (in mL). The source data are provided for the bar chart showing β-galactosidase activity in Figure 3—figure supplement 1A, which is represented as the means and SDs of three independent experiments.
Figure 3—figure supplement 1—source data 2. Raw data for growth curves.
The source data are provided for the growth curves in Figure 3—figure supplement 1C, which are represented as the means and SDs of three independent experiments.