. 2021 Jul 29;10:e64092. doi: 10.7554/eLife.64092

Figure 4. NirD can interact with the catalytic N-terminal region of RelA.

(A) Schematic representation of RelA and its protein domains. (B) Bacterial two-hybrid assay using E. coli BTH101 cells co-transformed with plasmid derivatives pUT18C-nirD and pKT25 with the full-length or truncated relA gene as indicated. Stationary-phase cultures were spotted on NA plates containing X-Gal as a blue color reporter for positive interaction. The bars showing β-galactosidase activity are represented as the means of three independent experiments, and the error bars depict the SDs.

Figure 4—source data 1. Determination of β-galactosidase activity.
The relative β-galactosidase activity was calculated as follows:1000×Slope(ΔOD420nmΔt)V×OD600nm. Slope is estimated by linear regression, and V is the volume of culture used (in mL). The source data are provided for the bar chart showing β-galactosidase activity in Figure 4B, which is represented as the means and SDs of three independent experiments.

Figure 4.

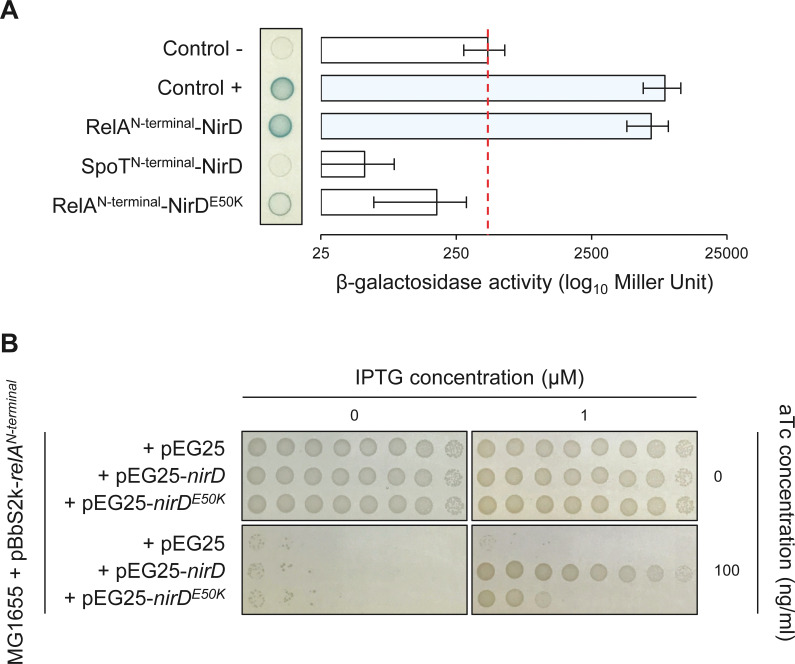
Figure 4—figure supplement 1. The RelAN-terminal-NirD interaction appears specific.

Figure 4—figure supplement 1.

(A) Bacterial two-hybrid assay using E. coli BTH101 cells co-transformed with plasmid derivatives pKT25-relAN-terminal or pKT25-spoTN-terminal and pUT18C-nirD or pUT18C-nirDE50K. Stationary-phase cultures were spotted on NA plates containing X-Gal as a blue color reporter for positive interaction. The bars showing β-galactosidase activity are represented as the means of three independent experiments, and the error bars depict the SDs. (B) Growth assay of E. coli MG1655 cells co-transformed with the plasmid derivatives pBbS2k-relAN-terminal and pEG25-nirD or pEG25-nirDE50K inducible by anhydrotetracycline (aTc) and isopropyl β-D-1-thiogalactopyranoside (IPTG), respectively. Serial dilutions of stationary-phase cultures were spotted on NA plates containing the indicated concentrations of inducers. The results are representative of three independent experiments.
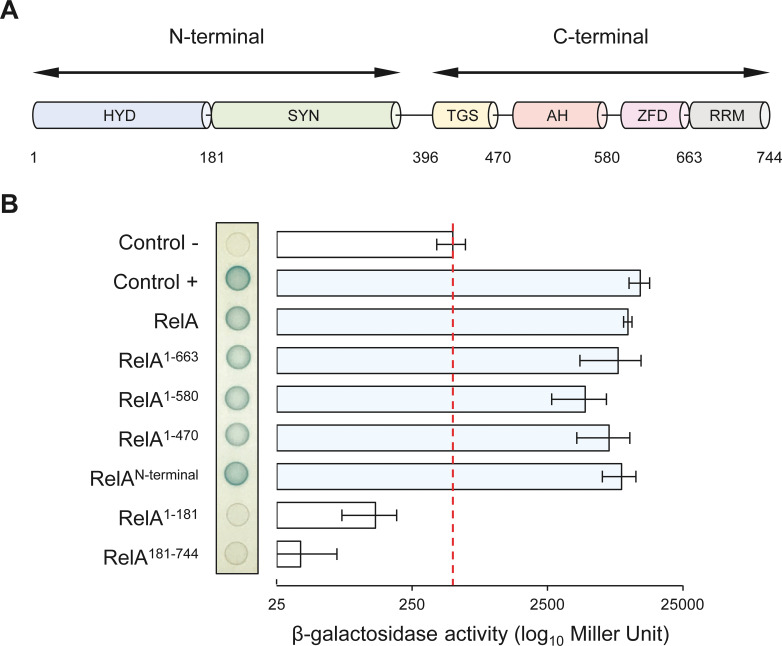
Figure 4—figure supplement 1—source data 1. Determination of β-galactosidase activity.
The relative β-galactosidase activity was calculated as follows:1000×Slope(ΔOD420nmΔt)V×OD600nm. Slope is estimated by linear regression, and V is the volume of culture used (in mL). The source data are provided for the bar chart showing β-galactosidase activity in Figure 4—figure supplement 1A, which is represented as the means and SDs of three independent experiments.