. 2021 Jul 29;10:e64092. doi: 10.7554/eLife.64092

Figure 5. NirD directly interact with the catalytic N-terminal region of RelA.

(A) Biolayer interferometric assay of RelAN-terminal on NirD or NirDE50K. Biotinylated NirD or NirDE50K were immobilized on streptavidin biosensors and probed with RelAN-terminal at concentrations ranging from 0.1 to 30 µM. The curves are represented as the means of the subtracted reference binding responses during association and dissociation from three experiments, the error bars depicting the SDs. The inset curve shows the specific biolayer interferometry (BLI) response (nm) 10 s before the end of association as a function of RelAN-terminal concentration. Data are represented as the means of the three experiments, the error bars depicting the SDs. (B, C) Isothermal titration calorimetry profiles corresponding to the binding of RelAN-terminal 30–300 µM NirD (B) or 300 µM NirDE50K (C) at 25°C. The upper panels show raw data for titration of NirD or NirDE50K with RelAN-terminal, and the lower panels show the integrated heats of binding obtained from the raw data. The data were fitted using a ‘One Set of Sites’ model in the PEAQ-ITC Analysis Software.

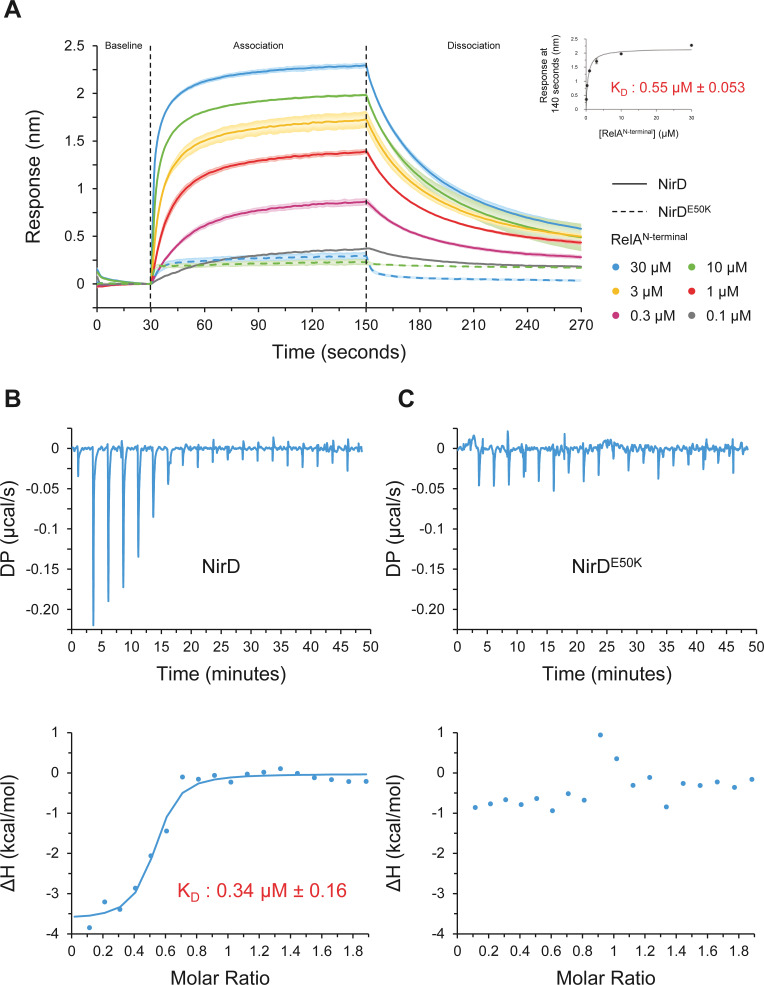
Figure 5—source data 1. Raw data for biolayer interferometry (BLI) experiments.
The source data are provided for the BLI experiments in Figure 5A, which are represented as the means and SDs of three independent experiments.
elife-64092-fig5-data1.xlsx (458.1KB, xlsx)
Figure 5—source data 2. Raw data for isothermal titration calorimetry experiment run with NirD.
Figure 5—source data 3. Raw data for isothermal titration calorimetry experiment run with NirDE50K.

Figure 5.

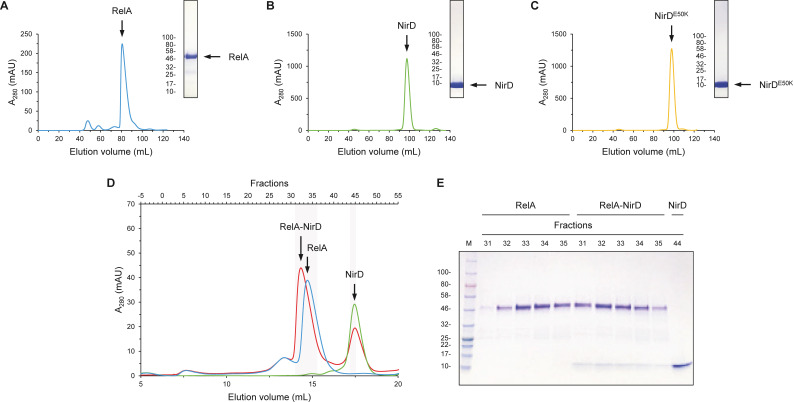
Figure 5—figure supplement 1. NirD can directly interact with the catalytic N-terminal region of RelA.

Figure 5—figure supplement 1.

(A–C) Purification of RelAN-terminal (A), NirD (B), and NirDE50K (C) using size-exclusion chromatography (SEC). The curves show the absorbance at 280 nm as a function of the elution volume. The SEC elution fractions indicated by arrows were analyzed by 12% SDS-PAGE. For SDS-PAGE, molecular weight markers are expressed in kDa. (D, E) SEC experiment separating RelAN-terminal and NirD alone or pre-mixed. (D) The curves show the absorbance at 280 nm as a function of the elution volume. The SEC elution fractions highlighted were analyzed by 12% SDS-PAGE (E). For SDS-PAGE, molecular weight markers are expressed in kDa.
Figure 5—figure supplement 1—source data 1. Raw data for purification of RelAN-terminal.
Figure 5—figure supplement 1—source data 2. Raw SDS-PAGE for RelAN-terminal purification.
Figure 5—figure supplement 1—source data 3. Raw data for purification of NirD.
Figure 5—figure supplement 1—source data 4. Raw SDS-PAGE for NirD purification.
Figure 5—figure supplement 1—source data 5. Raw data for purification of NirDE50K.
Figure 5—figure supplement 1—source data 6. Raw SDS-PAGE for NirDE50K purification.
Figure 5—figure supplement 1—source data 7. Raw data for size-exclusion chromatography experiment separating RelAN-terminal and NirD alone or pre-mixed.
Figure 5—figure supplement 1—source data 8. Raw SDS-PAGE for size-exclusion chromatography experiment.