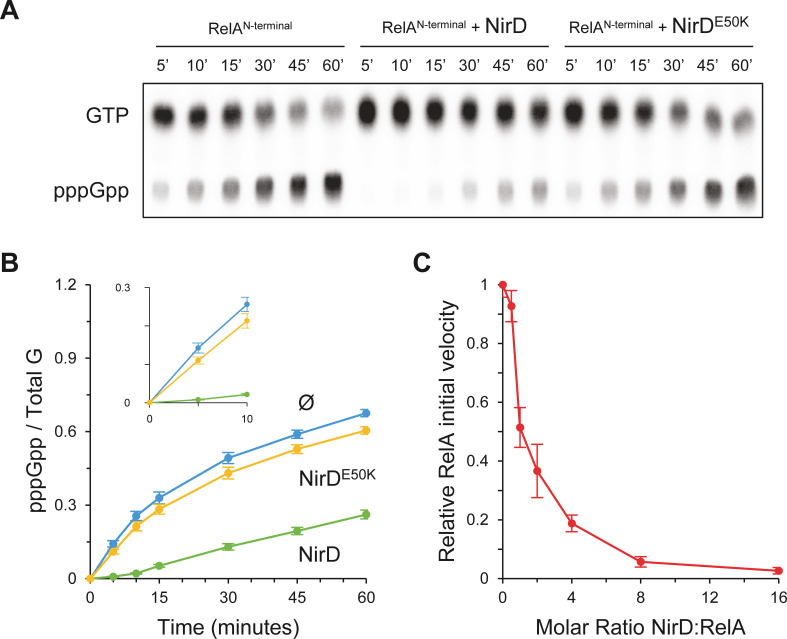
Figure 6. NirD inhibits RelA activity in vitro.
(A, B) In vitro pppGpp formation by 1 µM RelAN-terminal in the presence or absence of 4 µM NirD or NirDE50K. Samples collected at the indicated times were separated by thin layer chromatography (TLC). The autoradiogram (A) is representative of three experiments, and the curves of the relative levels of pppGpp (B) are represented as the means of the three experiments, the error bars depicting the SDs. (C) Relative initial velocity of RelA as a function of NirD:RelA molar ratio. The in vitro formation of pppGpp by 1 µM RelAN-terminal was assayed in the presence or absence of NirD at concentrations ranging from 0.5 to 16 µM. Samples were collected every 30 s over a period of 150 s and separated by TLC to determine the relative initial velocity (estimated by linear regression using five data points). Results are represented as the means of three experiments, and the error bars depict the SDs.

