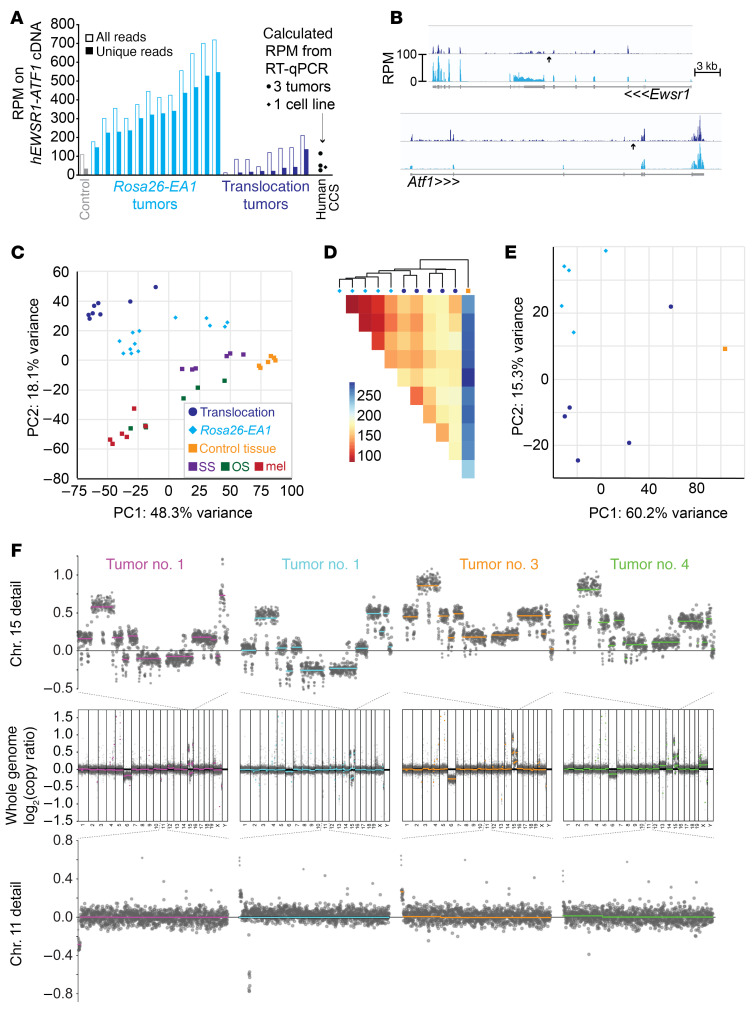
Figure 5. Cre-mediated translocation model of clear cell sarcomagenesis mimics the transcriptome of the EWSR1-ATF1 expression model but has additional genome CNAs.
(A) Graph of the RPM that aligned onto the human EWSR1-ATF1 fusion oncogene cDNA coding sequence expressed conditionally from the Rosa26 locus and from the HprtCre-induced translocation tumor. For reference, also noted are the RT-qPCR–calculated RPM levels of EWSR1-ATF1 expression from the human SU-CCS1 cell line and from 3 FFPE human CCS tumor specimens, using B2M as a control in the human samples and its average expression across the mouse samples to calculate an RPM estimate. (B) RPM alignments across the genomic sequence for Ewsr1 and Atf1, averaged across 8 translocation-generated tumors (dark blue) and 12 Rosa26-EA1 tumors (cyan), demonstrating overall lower expression (compared with cDNA expression in the EA1 tumors) and a reduced 3′ bias in the exons 3′ to the translocation point (arrow) of Ewsr1 relative to the same in Atf1 in the translocation-generated tumors, which may represent reduced expression of the exons 3′ to the translocation in Ewsr1 or increased expression of the exons 3′ to the translocation in Atf1. (C) PCA demonstrating relative clustering of 8 translocation-driven sarcomas with Rosa26-EA1–driven comparators, separate from the clusterings of other mouse cancer subtypes sequenced in the same batch as the EA1 tumors. SS, synovial sarcoma; OS, osteosarcoma; mel, melanoma. (D) Heatmap of the Pearson’s correlation distance between single-batch–sequenced transcriptomes of the Rosa26-EA1–driven (cyan diamonds) or HprtCre-induced translocation–driven (blue circles) sarcomas, as well as 1 control tissue sample. (E) PCA of the same transcriptomes as in D. (F) CNA analysis on 4 HprtCre-induced translocation tumors, using a low-read-depth whole-genome sequencing approach. The upper row shows higher-resolution images of chromosome 15 from the sequencing of each tumor, the middle row shows the CNAs across the entire genome, and lower row shows chromosome 11 from each.

