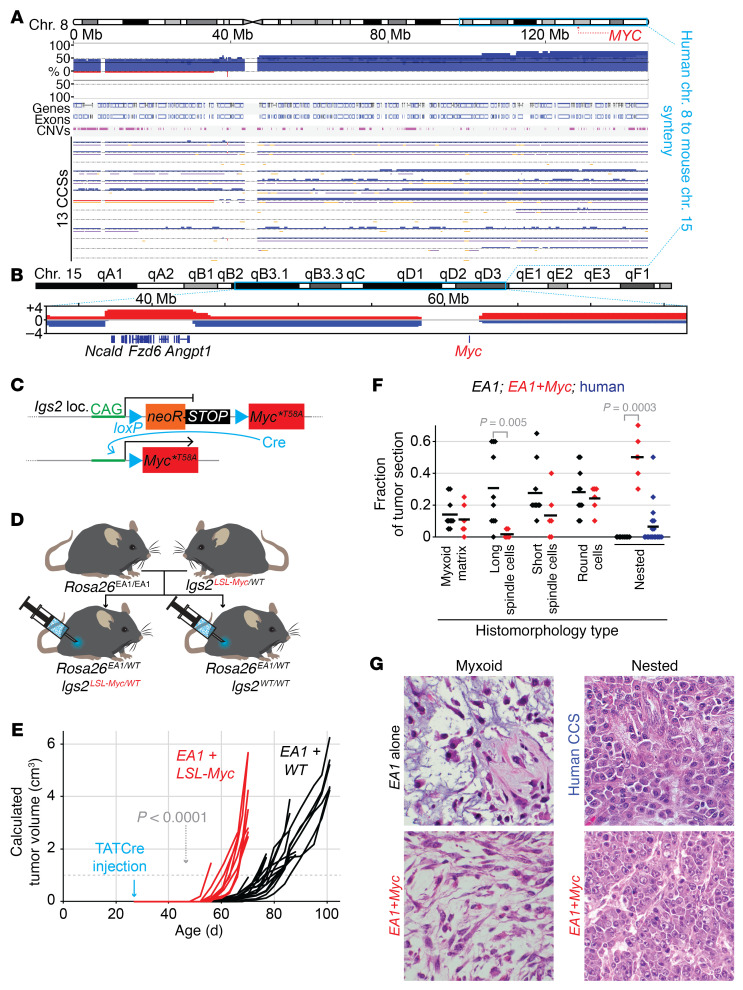
Figure 7. MYC stabilization enhances EWSR1-ATF1–induced sarcomagenesis but alters tumor phenotypes.
(A) BioDiscovery data on CNAs in regions of human chromosome 8 that are syntenic to amplified regions of mouse chromosome 15 and that flank MYC. (B) CNAs in regions of mouse chromosome 15 syntenic to human chromosome 8 and surrounding Myc. (C) Schematic showing the floxed stop cassette that allows for Cre-inducible expression of MycT58A at the Igs2 locus. (D) Breeding strategy to generate mice that express both EWSR1-ATF1 (EA1) and MycT58A upon TATCre injection, as well as Igs2WT/WT littermate controls. (E) Tumor growth curves for Rosa26EA1/WT mice with either Igs2LSL-Myc/WT (red) or Igs2WT/WT (black), following TATCre injection at 28 days of age. (F) Graph of the blinded quantitation of H&E-stained slides for histologic features distinguishing tumors expressing EA1 alone and tumors expressing EA1 plus MycT58A (EA1+Myc, red), with, for reference, the prevalence of the nested morphology observed in human CCSs on a tissue microarray (n = 20). (G) Photomicrographs of H&E-stained tissue sections demonstrating the 2 variants on myxoid features, 1 in each genotype, as well as the nested histomorphology observed focally in 7 human tumors (n = 20) and all Myc-activating mouse tumors (each photomicrograph is a 100 μm square obtained with a 60× original magnification objective lens).

