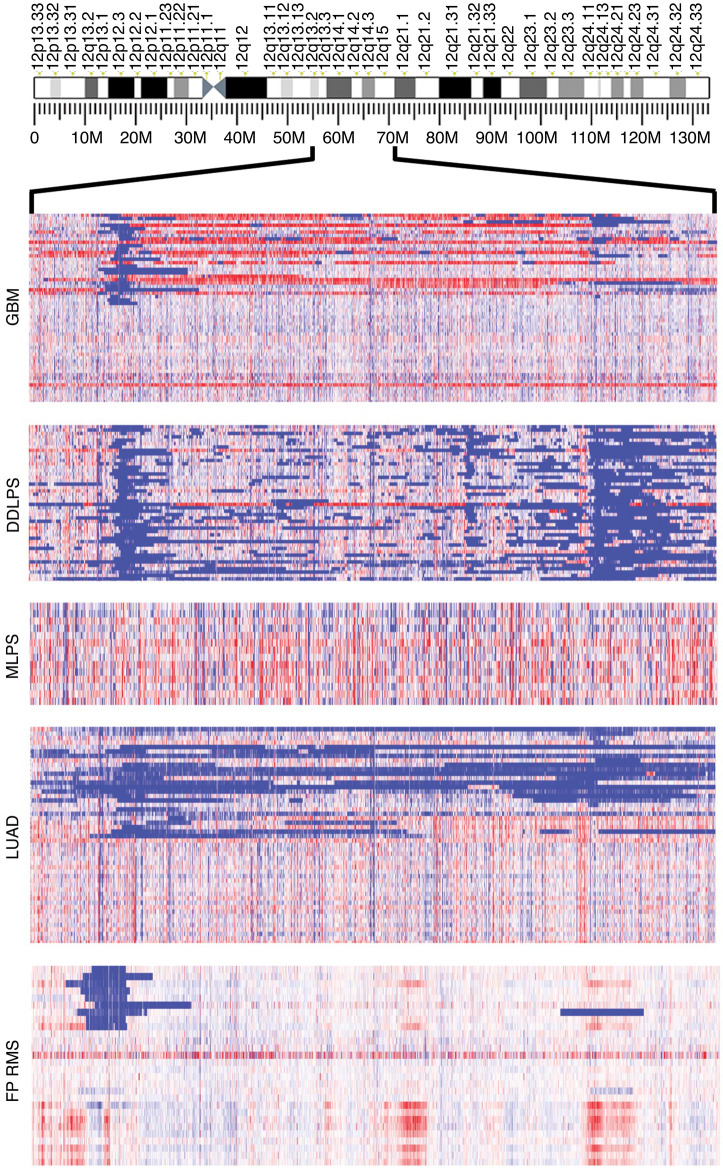
Figure 1. Amplicon distribution in the 12q13-q15 region across tumor types.
The amplicons defined by the Nexus SNP-FASST2 algorithm are shown in a subset of amplicon-positive and amplicon-negative samples for each tumor type. Blue represents copy number gains, while red represents losses in the region.

