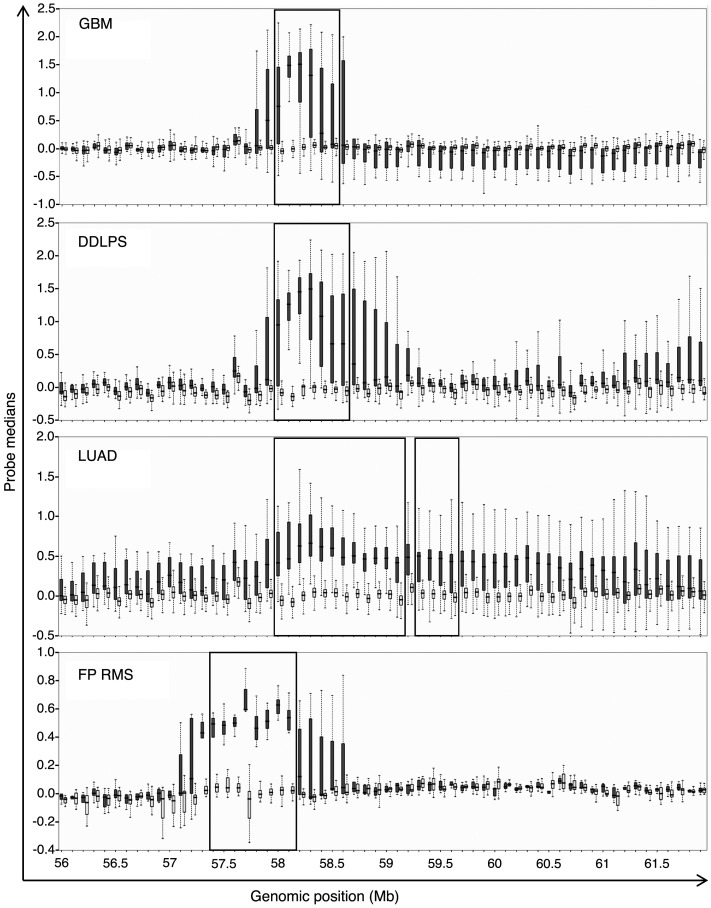
Figure 2. Location of the 12q13-q14 amplicon across tumor types.
A 6 Mb region was split into 100 kb intervals and analyzed for significant differences in copy number between amplicon-positive samples (gray) and amplicon-negative samples (white). The regions indicated with black rectangles represent high-confidence regions of amplification as defined by copy number changes with Bonferroni’s corrected P values ≤ 0.05 and fold changes ≥ 1.4.

