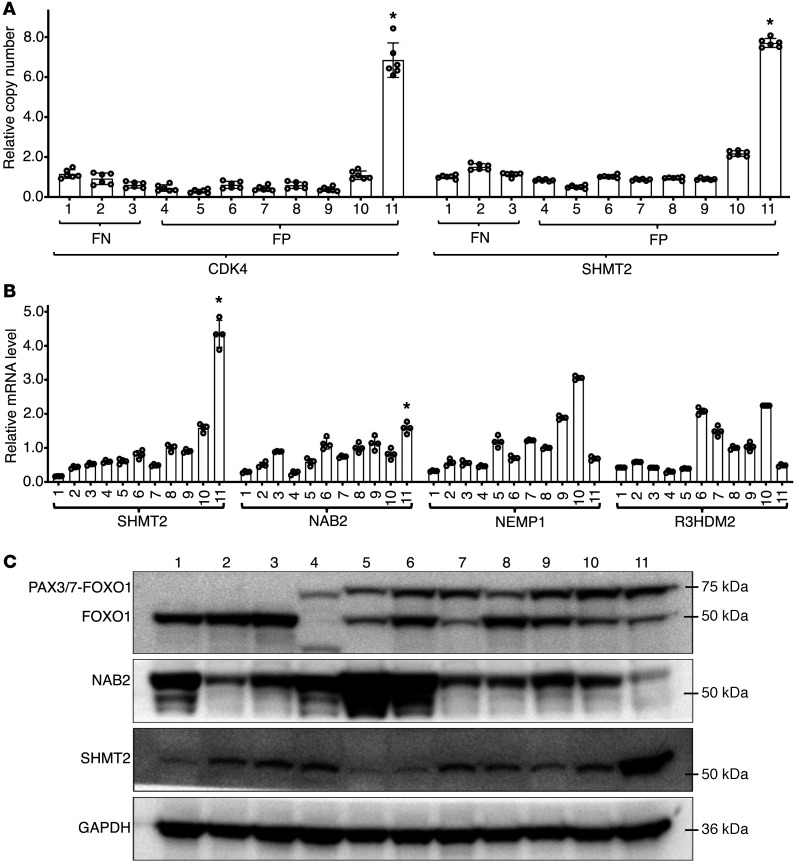
Figure 4. Amplification and expression of the 12q13-q14 region in RMS cell lines.
Cell lines are indicated by numbers: FN: 1-Rh6, 2-RD, 3-SMS-CTR; FP: 4-CW9019, 5-MP4, 6-RMS-097, 7-Rh3, 8-Rh5, 9-Rh28, 10-Rh41 and 11-Rh30 (all were PAX3-FOXO1-positive except for CW9019, which is PAX7-FOXO1-positive). (A) Screening for the 12q13-q14 amplicon in RMS cell lines. Graph shows relative copy numbers of CDK4 and SHMT2 in genomic DNA quantified by qPCR and normalized against the centromeric D12Z3. RD cells were used as a negative control in which copy numbers of CDK4 and SHMT2 were set at 1.0. Data are represented as mean ± SD of 6 technical replicates from 2 biological replicates. Statistical analysis of copy numbers in Rh30 versus the other lines was performed using Student’s t test. *P < 0.01. (B) mRNA expression of NEMP1, NAB2, SHMT2, and R3HDM2. Graph shows relative mRNA expression quantified by quantitative reverse-transcriptase PCR (qRT-PCR). GAPDH was used for normalization. Data are represented as mean ± SD of 4 replicates. Statistical analysis of expression differences in Rh30 versus the other lines was performed using Student’s t test. *P < 0.05. (C) Protein expression of SHMT2, NAB2, FOXO1, and PAX3/7-FOXO1 in cell lines. The immunoblot was probed with SHMT2 antibody, stripped, and reprobed with other antibodies. Relevant areas of the blot are shown. GAPDH was used as a loading control.

