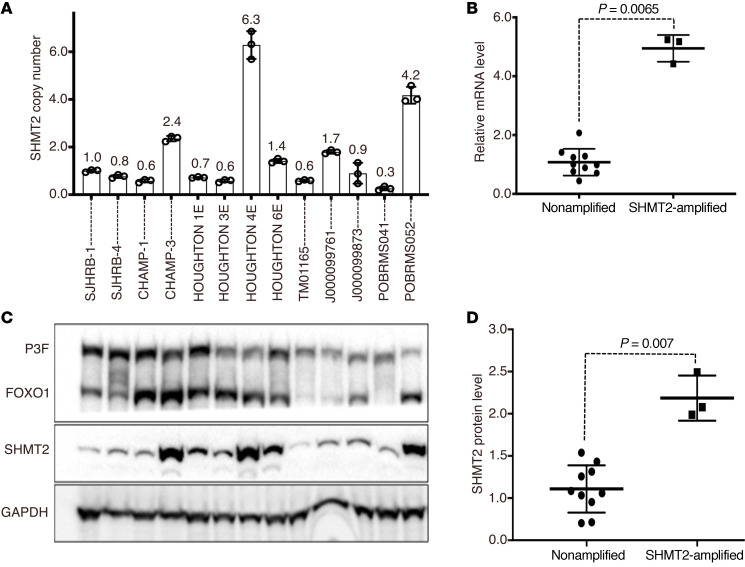
Figure 5. Amplification and expression of SHMT2 in FP RMS PDX tumors.
(A) SHMT2 amplification in a set of 13 FP RMS PDX tumors. Graph shows relative copy numbers of SHMT2 in genomic DNA quantified by qPCR and normalized against the centromeric D12Z3. Data are represented as mean ± SD of 3 replicates. (B) SHMT2 mRNA expression. Tumors are categorized into 2 groups based on the SHMT2 copy number: amplification negative (SJHBR1, SJHBR4, CHAMP1, HOUGHTON1E, HOUGHTON3E, HOUGHTON6E, TIM01165, J000099761, J000099873 and POBRMS041) with a copy number less than 2 and amplification positive (11-CHAMP3, HOUGHTON4E, and 13-POBRMS052) with a copy number greater than 2. A distribution plot shows relative mRNA expression quantified by qRT-PCR in the 2 groups. GAPDH was used for normalization of RNA-expression data. Each point represents the mean expression value of 3 technical replicates of each tumor. (C) SHMT2 protein expression. Protein expression of PAX3-FOXO1 (P3F), FOXO1, SHMT2, and GAPDH (loading control) was assessed in PDX tumors by immunoblotting. (D) Quantitation of SHMT2 protein level. Protein bands were inverted and quantified by ImageJ. Relative protein levels were expressed as a ratio of the band intensities of SHMT2 and GAPDH. Distribution plot shows the relative SHMT2 protein levels in the 2 groups. Statistical analysis of expression differences between the 2 groups in B and D was performed using Student’s t test (2 tailed, nonparametric, and nonpairing) in Prism 8.

