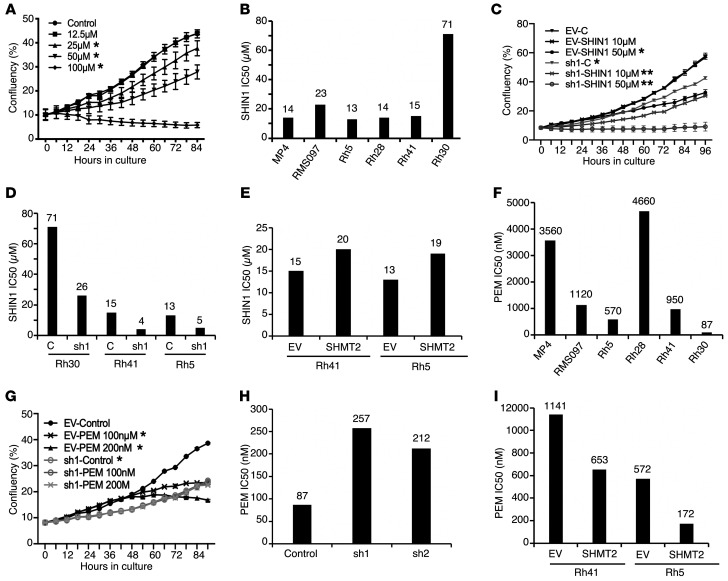
Figure 8. Effect of SHMT2 inhibitors on RMS cell growth.
(A) IncuCyte assay of SHIN1 effect on cell growth. Rh30 cells were treated with indicated SHIN1 concentrations. Data are represented as mean confluence values ± SEM of 4 well replicates. (B) IC50 of SHIN1 in RMS cell lines. Cells (4 wells per dose) were treated with control (DMSO) or 2-fold serial dilutions of SHIN1 (from 1.56 to 100 μM). Mean confluence values at 96 hours were used to calculate IC50. (C) Effect of SHIN1 on growth of SHMT2 shRNA-expressing Rh30 cells. Assay was performed as described for A. (D) IC50 of SHIN1 in Rh30, Rh41, and Rh5 cells expressing control or SHMT2 shRNA. Assay was performed as described in B. (E) IC50 of SHIN1 in Rh41 and Rh5 cells expressing control or SHMT2 construct. Assay was performed as described for B. (F) IC50 of PEM in RMS cell lines. Assay was performed as described for B with PEM concentrations ranging from 50 to 6400 nM. (G) Effect of PEM on growth of control or SHMT2 shRNA-expressing Rh30 cells. Cells were treated with indicated PEM concentrations, and growth was monitored as described for A. (H) IC50 of PEM in control or SHMT2 shRNA-expressing Rh30 cells. Assay was performed as described for F. (I) IC50 of PEM in Rh41 and Rh5 cells expressing control or SHMT2 construct. Assay was performed as described for F. Experiments shown in A, C, and G were repeated at least 3 times, and ANOVA tests (corrected for multiple comparisons) were performed for the last 6 time points. *P < 0.05, adjusted (A and G); *P < 0.05 compared with EV-control (C); **P < 0.05 compared with sh1-control (C).

