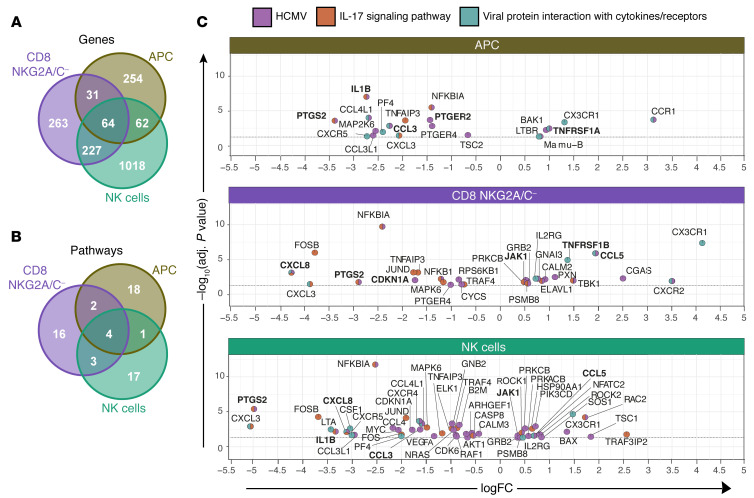
Figure 3. Gene expression profiles of dendritic cells, NK cells, and T cells in RhCMV– and RhCMV+ rhesus macaques.
(A) Venn diagram showing differently expressed genes (adjusted P < 0.05) in 3 sorted cell types examined for RhCMV– and RhCMV+ macaques. (B) Venn diagram showing the top 25 significant (P < 0.05) KEGG pathways. (C) Volcano-plot representations of differentially expressed genes in the indicated KEGG pathways among CD11c+ DCs (top), NKG2A/C–CD8+ T cells (middle), or NK cells (bottom) in RhCMV+ and RhCMV– macaques. Each colored pie slice indicates membership of the corresponding gene in the KEGG pathway; colors defined in the key. Transcriptomic analysis was performed of flow-sorted cell types from 6 RhCMV+ and 6 RhCMV– rhesus macaques. Differential expression analyses were conducted with the limma-voom Bioconductor pipeline, using a statistical model incorporating the flow-sorted cell population, RhCMV serostatus, and fragmentation time.

