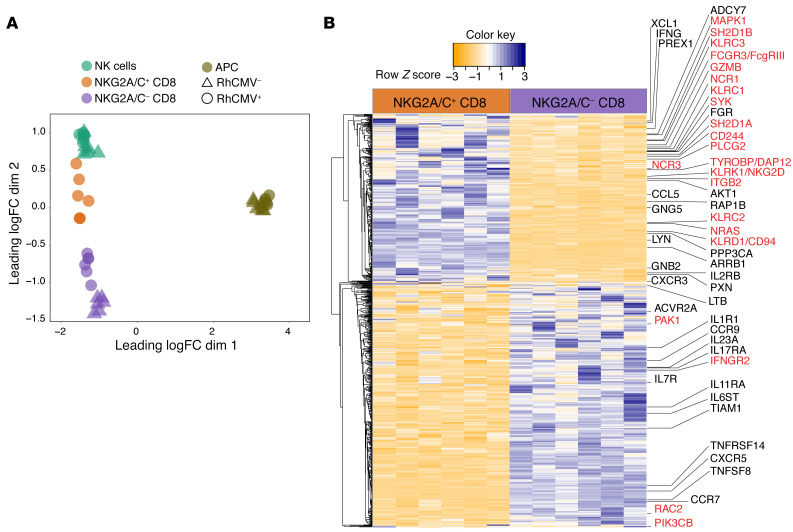
Figure 4. Gene expression of flow-sorted NKG2A/C+CD8+ T cells.
(A) MDS plot of transcript abundances using distances based on log2-fold differences. (B) Heatmap showing scaled values for transcripts that were found to be statistically different (adjusted P < 0.05) between NKG2A/C+ and NKG2A/C– CD8+ T cells in 6 RhCMV+ macaques.

