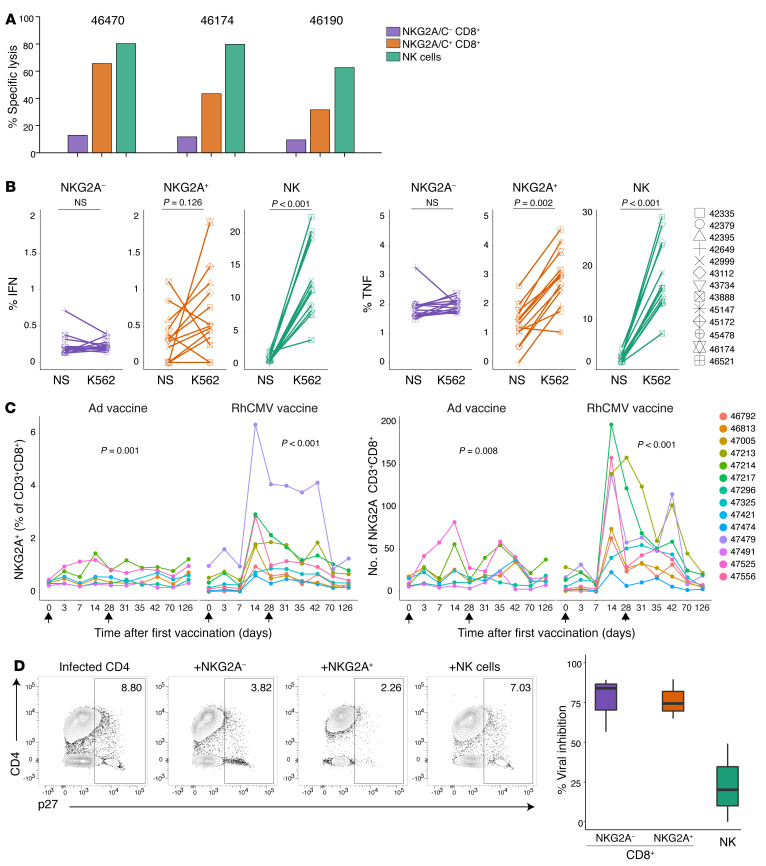
Figure 7. NKG2A/C+CD8+ T cells have functional capacities similar to those of NK cells.
(A) Cytolytic activity of sorted NKG2A/C–CD8+ T cells, NKG2A/C+CD8+ T cells, or NK cells from 3 RhCMV+ rhesus macaques against Calcein AM-stained K562 at an E/T ratio of 5:1. (B) Resting PBMCs from 13 RhCMV+ rhesus macaques were incubated for 6 hours alone or with K562. IFN-γ and TNF-α expression were analyzed after gating on NKG2A/C–CD8+ T cells, NKG2A/C+CD8+ T cells, or NK cells. Wilcoxon signed-rank tests were used to compare IFN-γ and TNF-α values. (C) Longitudinal representation of the percentage and absolute numbers of NKG2A/C+CD8+ T cells among lymphocytes before and after vaccination of 14 RhCMV– rhesus macaques. Changes in numbers of NKG2A/C+CD8+ T cells with vaccination time were evaluated with Friedman tests. (D) Left: Representative FACS plots demonstrating viral outgrowth inhibition (assessed by intracellular Gag p27) observed when autologous, infected CD4+ T cells are cultured alone or in the presence of sorted NKG2A/C–CD8+ T cells, NKG2A/C+CD8+ T cells, or NK cells at an E/T ratio of 1:1. Right: Percentage of viral inhibition. The assay was performed with spleen cells and PBMCs from necropsies, box plots show the median value, 25th and 75th quartiles, and the range of values, n = 3.

