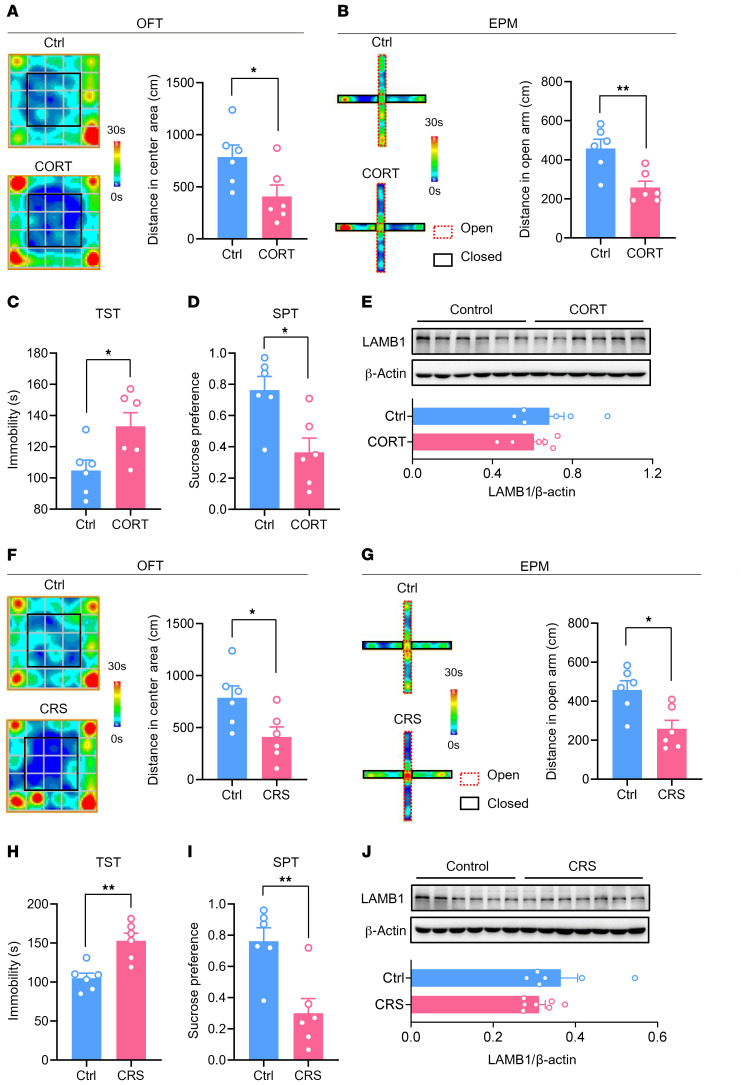
Figure 11. LAMB1 in the ACC is not involved in depression with no pain.
(A and B) Representative trajectory and quantitative summary of distances traveled in the center area in the OFT (A) and in the open arm in the EPM (B) for control and CORT-treated mice (n = 6). *P < 0.05 and **P < 0.01, by 2-tailed, unpaired t test. (C and D) Duration of immobility in the TST (C) and sucrose preference in the SPT (D) paradigm for control and CORT-treated mice (n = 6). *P < 0.05, by 2-tailed, unpaired t test. (E) Immunoblots and quantitative summary showing that LAMB1 expression was not altered in the ACC of CORT-treated mice as compared with the control group (n = 6). Two-tailed, unpaired t test. (F and G) Representative trajectory and quantitative summary of distances traveled in the center area in the OFT (F) and the open arm in the EPM (G) for control and CRS-treated mice (n = 6). *P < 0.05, by 2-tailed, unpaired t test. (H and I) Duration of immobility in the TST (H) and sucrose preference in the SPT (I) paradigm for control and CRS-treated mice (n = 6). **P < 0.01, by 2-tailed, unpaired t test. (J) Immunoblots and quantitative summary showing that LAMB1 expression was unchanged in the ACC in CRS-treated mice as compared with the control group (n = 6–7). Two-tailed unpaired separate variance estimation t test. Data are presented as the mean ± SEM. See Supplemental Table 2 for detailed statistical information.

