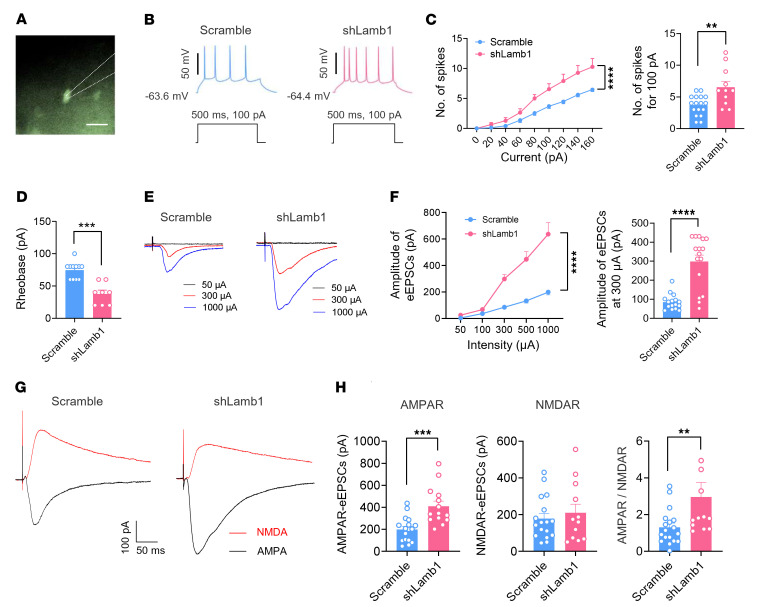
Figure 5. LAMB1 deficiency evokes neuronal hyperexcitability and synaptic potentiation in ACC pyramidal neurons.
(A) Whole-cell patch-clamp recording from ACC layer II/III pyramidal neurons. Scale bar: 50 μm. (B) APs induced by current injection at 100 pA in neurons expressing shLamb1 or scrambled shRNA (n = 11–17). (C) Left: I-O curve in response to a depolarizing current step (20 pA step, 500 ms duration) showing a higher firing frequency in mice expressing shLamb1 (n = 11–17). ****P < 0.0001, by Friedman’s M test. Right: Typical result at an intensity of 100 pA. **P < 0.01, by 2-tailed, unpaired separate variance estimation t test. (D) A lowered rheobase was observed after LAMB1 knockdown (n = 8–11). ***P < 0.001, by Mann-Whitney U test. (E and F) Representative traces (E) and I-O curve (F) of AMPAR-mediated eEPSCs following stimulation of layer V/VI ACC pyramidal neurons in mice of both genotypes (n = 16). ****P < 0.0001, by Friedman’s M test (left panel) and Mann-Whitney U test (right panel). Right panel in F shows typical quantification of AMPARs-eEPSCs evoked by 300 μA stimulation. (G and H) Representative traces (G) and quantitative summary (H) of AMPAR/NMDAR EPSC ratios for mice of both genotypes (n = 12–18). ***P < 0.001, by 2-tailed, unpaired t test for AMPARs-eEPSCs; **P < 0.01, by Mann-Whitney U test for NMDAR-eEPSCs and AMPAR/NMDAR. Data are presented as the mean ± SEM. See Supplemental Table 2 for detailed statistical information.

