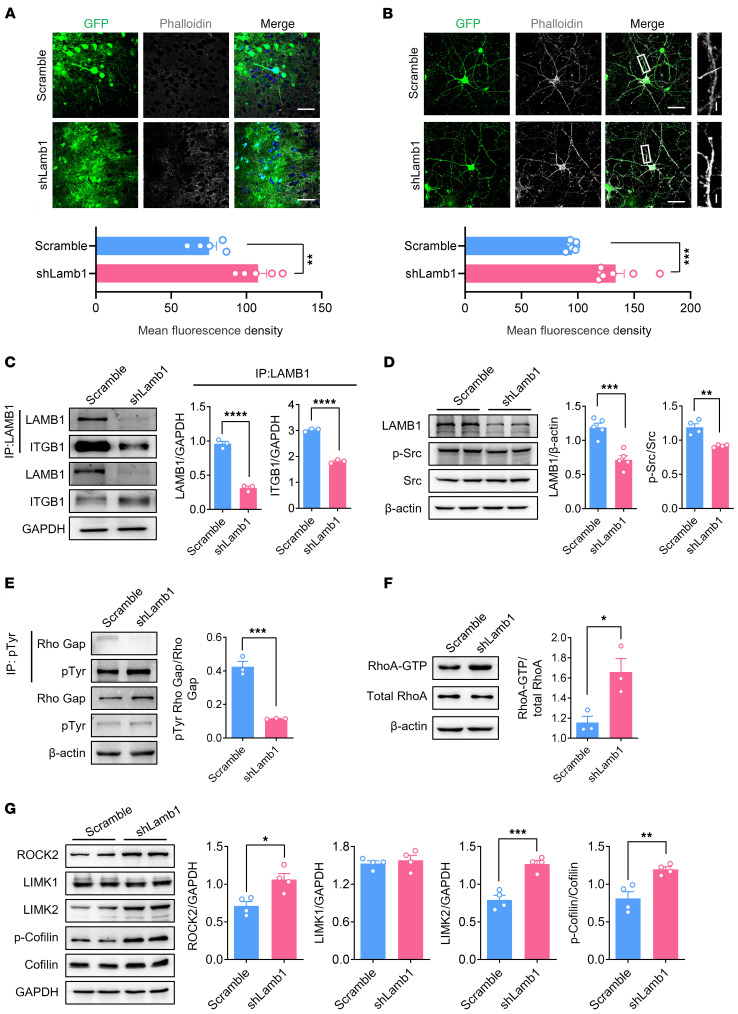
Figure 7. LAMB1-knockdown mice exhibit altered Src/RhoA/LIMK/cofilin signaling and dysregulated F-actin in the ACC.
(A and B) Confocal images of F-actin staining with phalloidin in ACC slices from mice expressing scrambled shRNA or shLamb1 (A) (n = 5) and cultured cortical neurons transfected with shLamb1 or scrambled shRNA (B) (n = 7). **P < 0.01 and ***P < 0.001, by 2-tailed, unpaired t test (A) and Mann-Whitney U test (B). Scale bars: 30 μm (A); 50 μm and 5 μm (enlarged insets)(B). (C) Representative immunoblots and quantitative summary of immunoprecipitated LAMB1 and integrin β1 in ACC lysates derived from mice expressing scrambled shRNA or shLamb1 (n = 3). ****P < 0.0001, by 2-tailed, unpaired t test. (D) Representative immunoblots and quantitative summary of levels of LAMB1, p-Src, and total Src in ACC lysates from mice expressing scrambled shRNA or shLamb1 (n = 4–5). **P < 0.01 and ***P < 0.001, by 2-tailed, unpaired t test (LAMB1/β-actin) and 2-tailed, unpaired separate variance estimation t test (p-Src/Src). (E) Representative immunoblots of immunoprecipitated p-Tyr and quantitative summary of p-Tyr, p190RhoGAP, and β-actin (loading control) levels (n = 3). ***P < 0.001, by 2-tailed, unpaired separate variance estimation t test. (F) Representative immunoblots and quantitative summary of RhoA-GTP and total RhoA levels using a pulldown assay (n = 3). *P < 0.05, by 2-tailed, unpaired t test. (G) Representative immunoblots and quantitative summary of ROCK2, LIMK1, LIMK2, p-cofilin, and total cofilin levels in ACC lysates derived from mice expressing scrambled shRNA or shLamb1 (n = 4). *P < 0.05, **P < 0.01, and ***P < 0.001, by 2-tailed, unpaired t test. Data are presented as the mean ± SEM. See Supplemental Table 2 for detailed statistical information.

