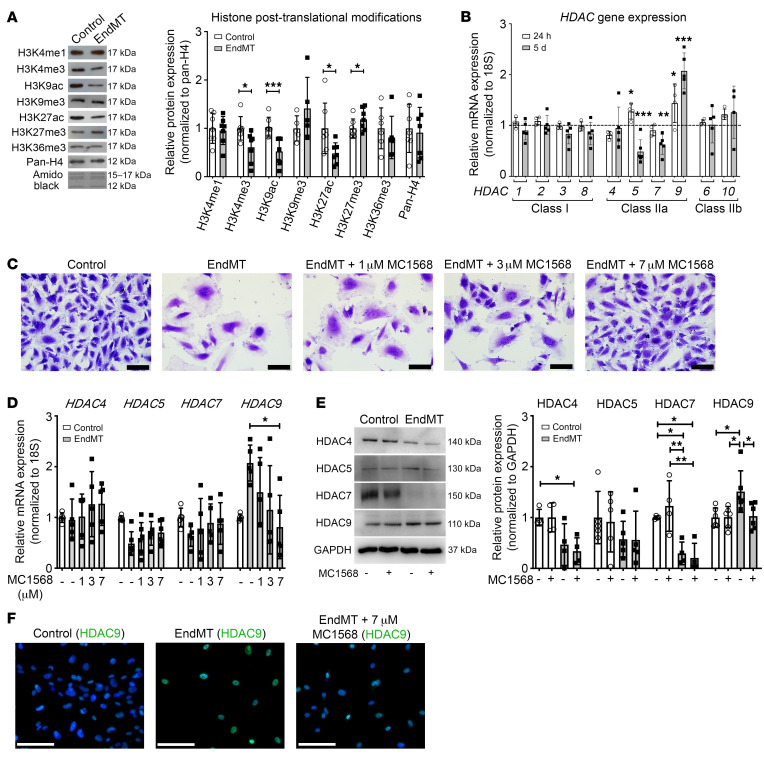
Figure 1. EndMT is associated with histone deacetylation and increased HDAC9 expression, which is ameliorated by class IIa HDAC inhibitor MC1568.
(A) Representative Western blots for histone PTMs after 5 days of EndMT induction in HCAECs with densitometric analysis demonstrating changes in histone acetylation and methylation. n = 5–7. (B) qRT-PCR showing time-dependent changes of canonical HDACs after 24-hour and 5-day EndMT induction (TGF-β2 plus H2O2) in HCAECs. Graph is representative of fold change relative to vehicle-treated control cells normalized to 1 (dashed line). n = 4–6. (C) Images of HCAECs after 5-day EndMT induction with or without increasing doses of MC1568. Scale bars: 100 μm. (D) qRT-PCR analysis showing mRNA expression of class IIa HDACs (HDAC4, -5, -7, and -9) after 5-day EndMT induction in HCAECs, with a dose-dependent effect of MC1568 on HDAC9 gene expression. n = 5–6. (E) Representative Western blots and densitometry measurements of class IIa HDACs after 5-day EndMT induction with or without MC1568 in HCAECs, with the graph representing fold change relative to vehicle-treated controls. n = 4–6. (F) Immunofluorescence staining of control HUVECs with anti-HDAC9 antibody and after 5-day EndMT induction with or without 7 μM MC1568. Scale bars: 100 μm. *P ≤ 0.05; **P ≤ 0.01; ***P ≤ 0.001. Analyses performed using unpaired Student’s t test (A), 1-way ANOVA (B and D), and 2-way ANOVA (E).

