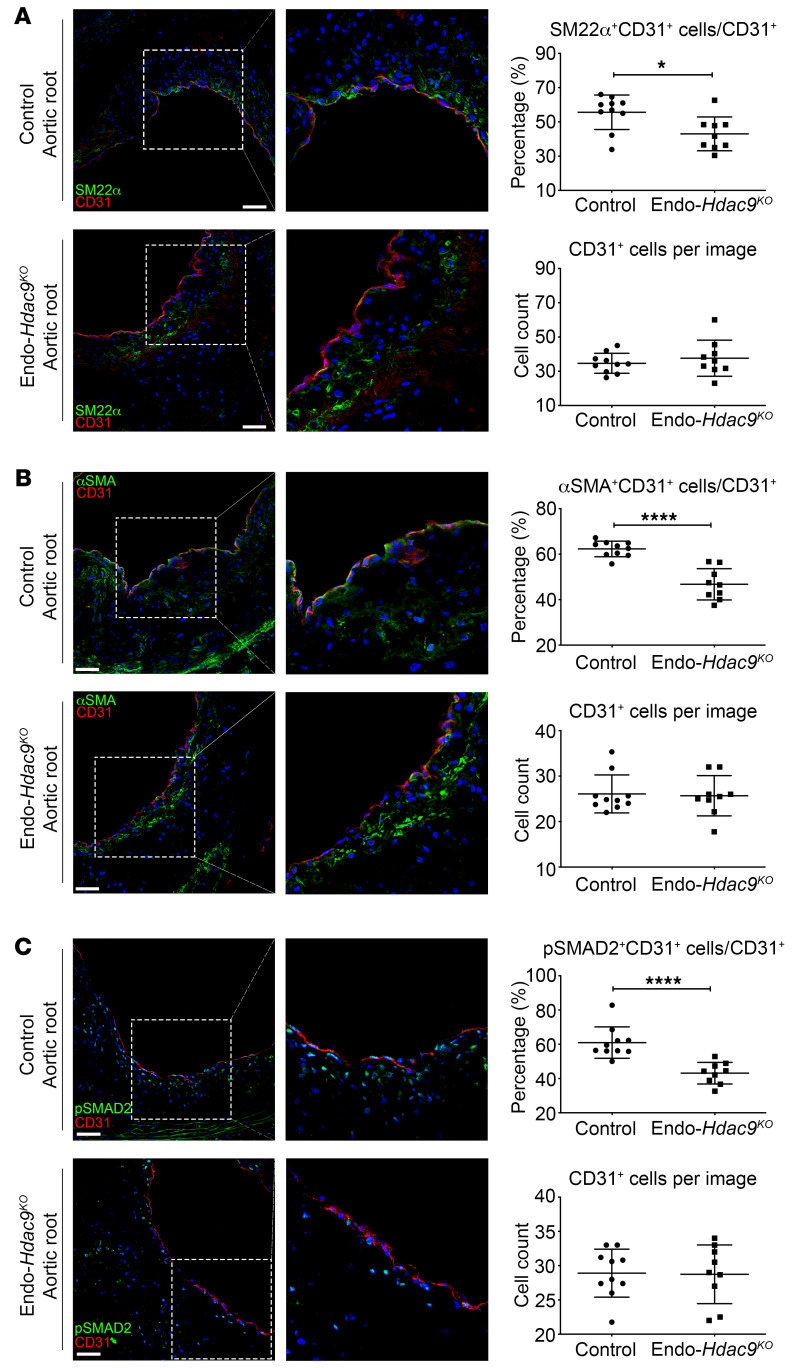
Figure 5. Endothelial-specific Hdac9 knockout reduces EndMT in vivo.
All comparisons in this figure were generated using aortic root sections from Endo-Hdac9KO mice versus littermate controls, and all mice received tamoxifen. (A) Representative immunofluorescence staining images for SM22α- (green), CD31- (red), and DAPI-stained nuclei (blue), quantification of SM22α+CD31+ copositive cells over total CD31+ cells, and total number of CD31+ cells per image. (B) Representative immunofluorescence staining images for αSMA- (green), CD31- (red), and DAPI-stained nuclei (blue), quantification of copositive cells over total CD31+ cells, and total number of CD31+ cells per image. (C) Representative immunofluorescence staining images for pSMAD2- (green), CD31- (red), and DAPI-stained nuclei (blue), quantification of copositive cells over total CD31+ cells, and total number of CD31+ cells per image. Scale bars: 50 μm. Right panels are digital enlargements of the original adjacent images. n = 10 controls versus n = 9 Endo-Hdac9KO mice. *P ≤ 0.05; ****P ≤ 0.0001. All analyses performed using unpaired Student’s t test except the following, for which Mann-Whitney U test was used: SM22α+CD31+ cells/CD31+ cells (A); CD31+ cells per image (B); and pSMAD2+CD31+ cells/CD31+ cells (C).

