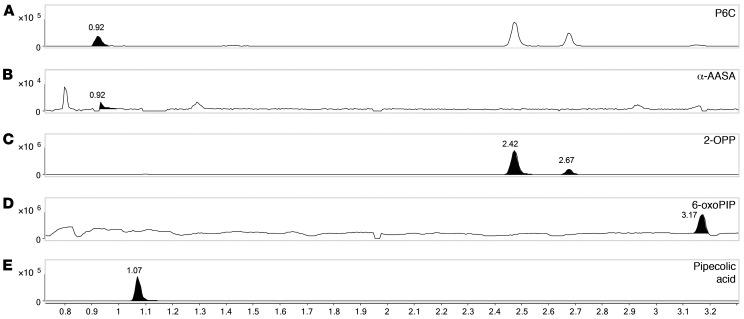
Figure 4. NGMS analysis of PDE-ALDH7A1 patient brain tissue extract.
Extracted-ion chromatograms in brain tissue extract of a PDE-ALDH7A1 patient of (A) P6C, m/z 128.0706, retention time (RT) 0.92 minutes, (B) α-AASA, m/z 146.0812, RT 0.92 minutes, (C) 2S,6S-2-OPP and 2S,6R-2-OPP, m/z 186.1123, RT 2.42 and 2.67 minutes, respectively, (D) 6-oxoPIP, m/z 144.0652, RT 3.17 minutes, and (E) pipecolic acid, m/z 130.0863, RT 1.07 minutes. The y axis represents relative NGMS intensity, and the x axis represents RT (minutes). Note that an in-source P6C fragment of both 2-OPP enantiomers is also observed at RT 2.42 and 2.67 minutes (A).

