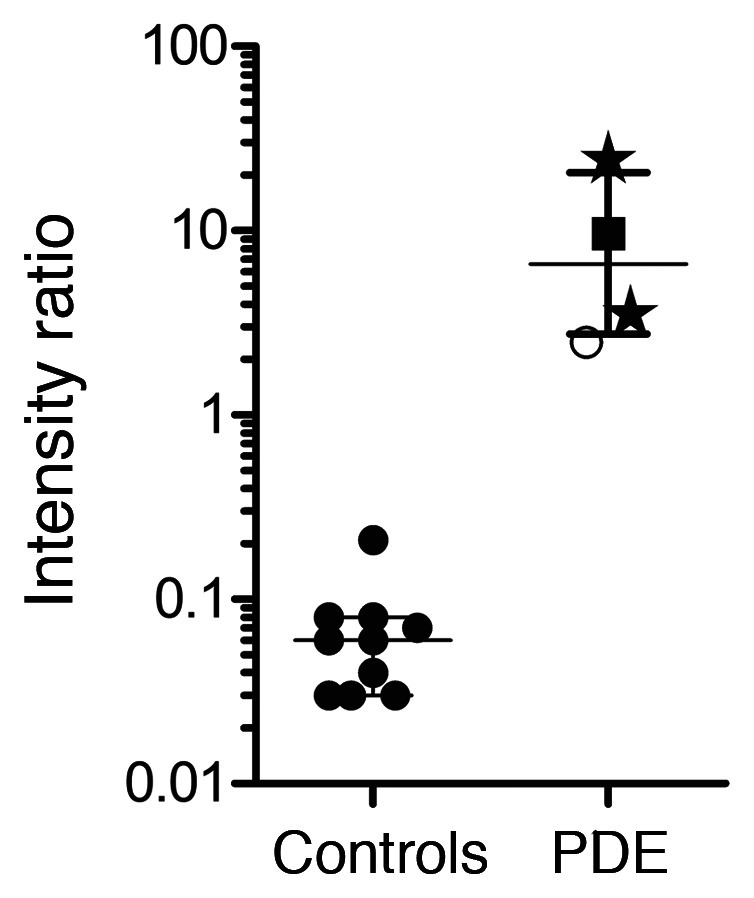
Figure 8. 2-OPP–based diagnosis of PDE-ALDH7A1 in DBS using a direct-infusion MS method.

The y axis shows the relative intensity ratio between 2-OPP and C6-carnitine, while on the x axis the categories of non-PDE controls (n = 10) and PDE-ALDH7A1 patients (PDE, n = 4) are plotted. Patient results were significantly increased compared with controls (Mann-Whitney U test, P < 0.006). Patient results are marked as follows: stars, neonatal DBS, untreated patients; filled squares, DBS from 10-year-old patient on vitamin B6 supplementation; open circles, DBS from untreated 16-year-old patient.
