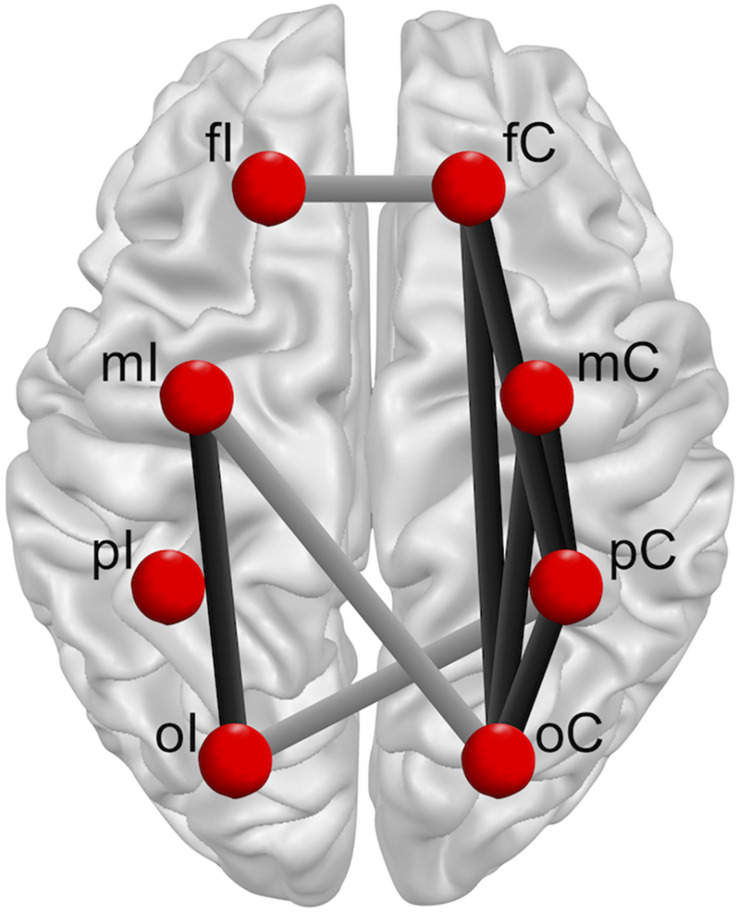
FIGURE 5.
Overview group × leg interactions for intra-hemispherical (black line) and inter-hemispherical connections (gray line) between Regions of interest (ROIs) (red dots). Ipsilateral (fI, mI, pI, oI) and contralateral (fC, mC, pC, oC) ROIs are exemplary shown for single leg stance on the left injured leg. The brain model was illustrated with Brain Voyager Brain Tutor commercially available software (http://www.brainvoyager.com).

