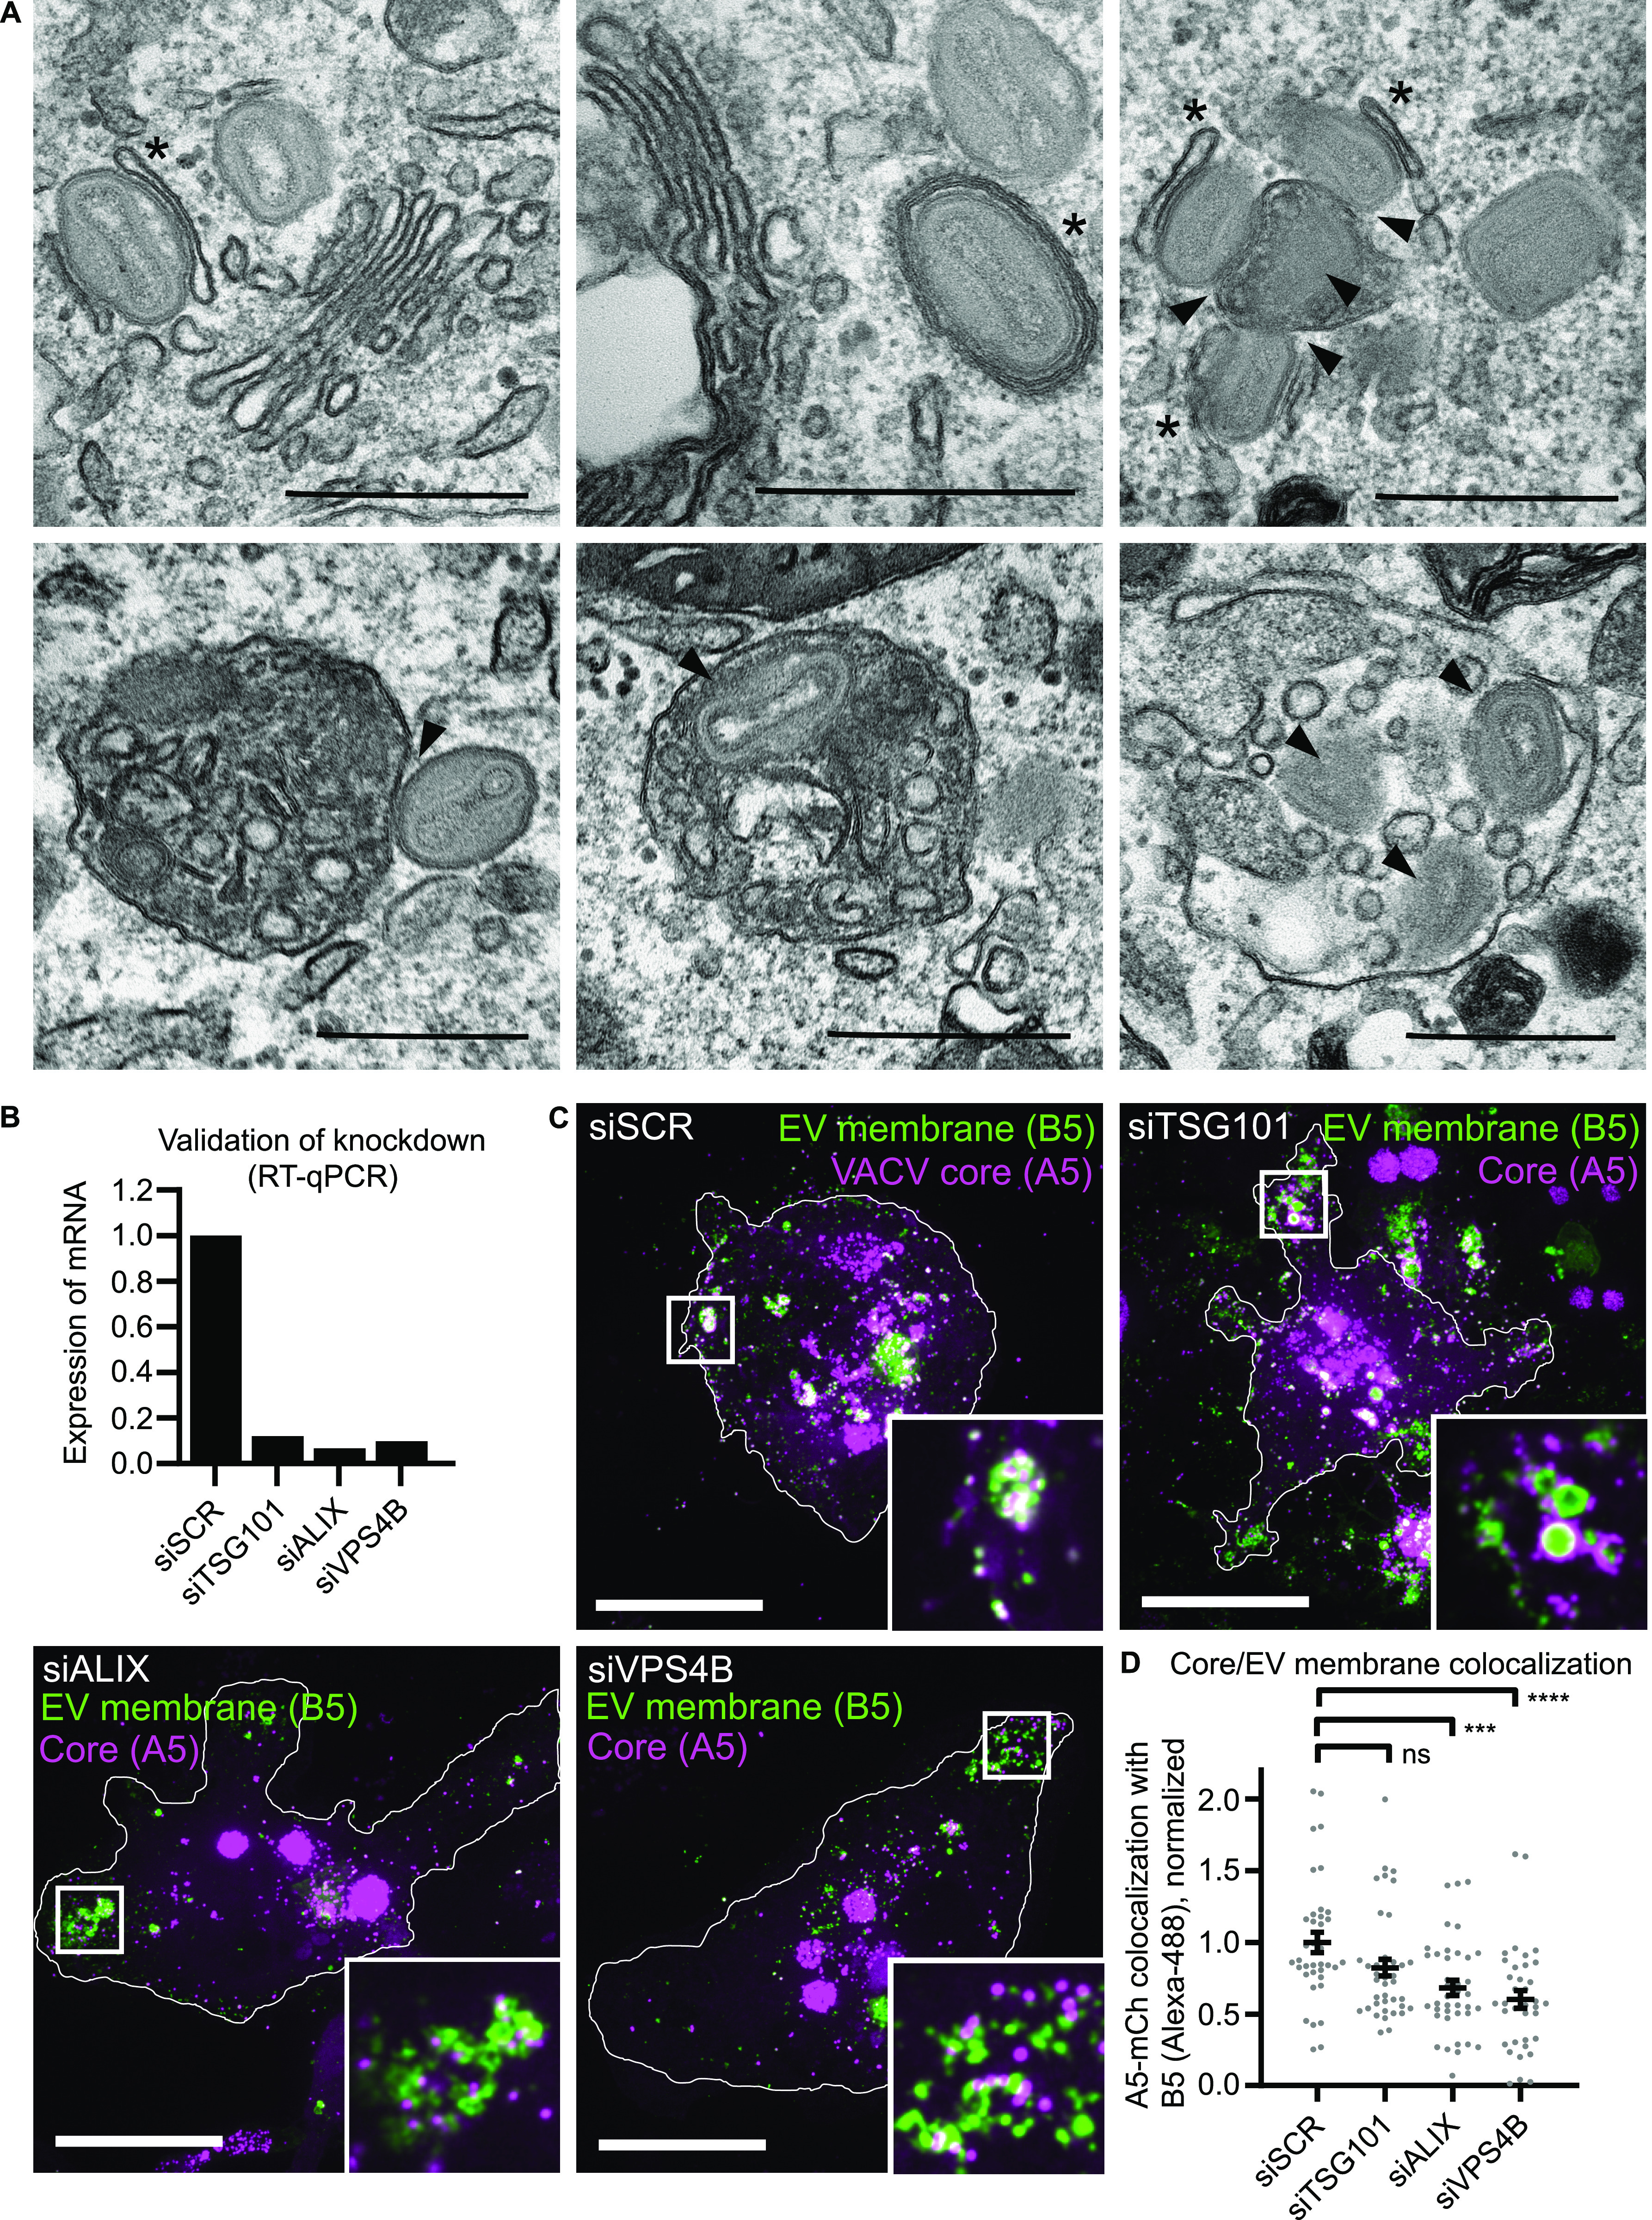
Figure 7. Endosomal sorting complexes required for transport–dependent formation of MVB-intracellular enveloped virions occurs in monocyte-derived macrophages.

(A) Representative EM images of VACV infected THP-1 macrophages (24 hpi). Both cis-wrapping (indicated by asterisk), and MVB-intracellular enveloped virions (arrowheads) are present. Scale bars = 500 nm. (B) qRT-PCR validation of siRNA knockdown efficiencies of TSG101, ALIX, and VPS4B depletion in THP-1s. Data are average of duplicate samples normalized to control (siSCR). (C) Representative images (maximum intensity projections) of THP-1 macrophages depleted of the indicated protein and infected with VACV (mCh-A5), fixed at 24 hpi, and immunostained for B5. Magenta = VACV core (A5), green = VACV envelope protein B5. Scale bars = 10 µm. Insets = 8× zoom. (C, D) Quantification of VACV core and EV membrane protein (B5) colocalization from (C). Data are mean ± SEM, two biological replicates, n = 35–45 cells per condition. Statistical analysis was performed using unpaired, nonparametric Kolmogorov–Smirnov test (***P < 0.001; ****P < 0.0001).
