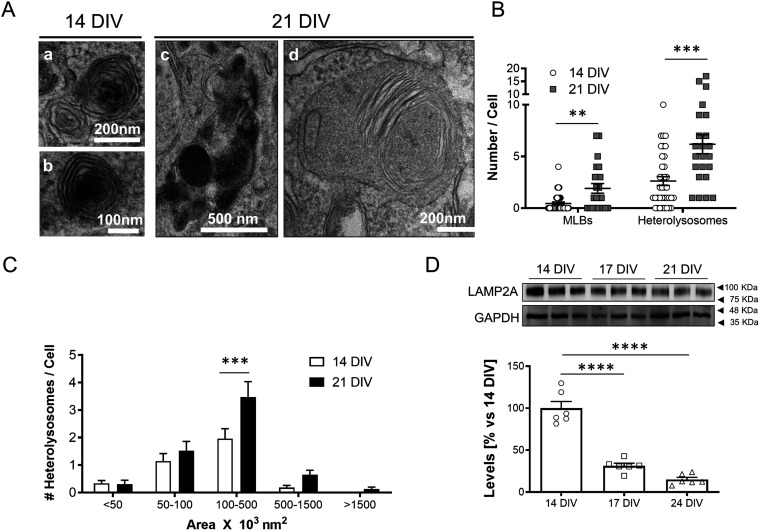
Figure 1. Changes in degradative function with age in cultured neurons.
(A) Representative transmission electron microscopy (TEM) images showing secondary lysosomal structures (heterolysosomes [Aa and Ac] and multilamellar bodies [Ad]) in 14 DIV (Aa, Ab) or 21 DIV (Ac, Ad) neurons. (A, B) Plot with the average number of multilamellar bodies (MLBs) and heterolysosomes per cell, calculated from TEM images such as the ones shown in panel (A) (n = 36 cells for 14 DIV and MLBs; n = 37 cells for 14 DIV and heterolysosomes; n = 23 cells for 21 DIV and both MLBs and heterolysosomes, N = 3 independent cultures). The graph shows the mean ± SEM. Statistical significance was analyzed by the two-tailed Mann–Whitney test (**P < 0.01, ***P < 0.001; P-value for MLBs: 0.0025; P-value for heterolysosomes: 0.0004). (C) Plot showing the distribution of heterolysosomes per cell grouped by ranges of areas (×103 nm2), calculated from TEM images such as the ones shown in panel a (n = 98 heterolysosomes for 14 DIV; n = 140 heterolysosomes for 21 DIV; N = 3 independent cultures). The graph shows the mean ± SEM. Statistical significance was analyzed by two-way ANOVA (P-value for interaction = 0.0289). Post hoc analysis was performed with Sidak’s multiple comparisons test (***P < 0.001; P-value for 100–500 nm3 × 103 nm2: 0.0002). (D) Western blot analysis of LAMP2A as measurement of chaperone-mediated autophagy with age in culture. Note that LAMP2A protein levels decrease with age in vitro, from 14, 17 and 21 DIV. An anti-GAPDH antibody was used to normalize the LAMP2A protein levels. A graph with the LAMP2A levels relative to 14 DIV neuronal culture is shown under the Western blot panels (n = 6 independent cultures). The graph shows the mean ± SEM. Statistical significance was analyzed by one-way ANOVA (P < 0.0001). Post hoc analysis was performed with Dunnet’s multiple comparisons test (****P < 0.0001 for all comparisons).

