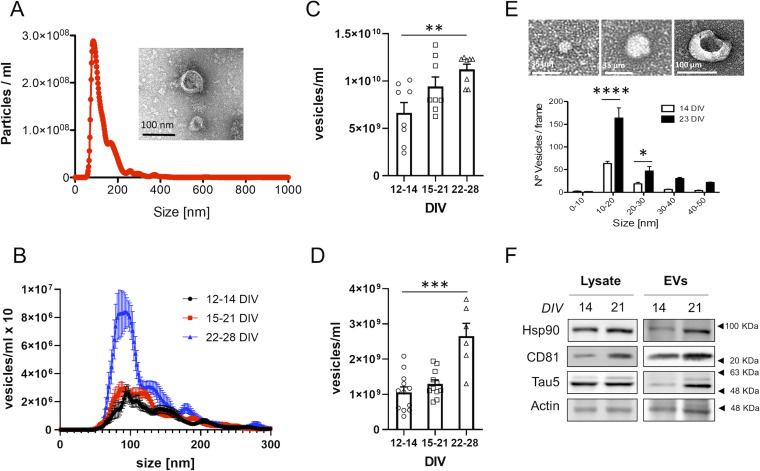
Figure 2. Characterization of extracellular vesicles secreted by young and old neuronal cultures.
(A) Representative plot showing the size distribution of the vesicles present in the medium of a rat neuronal culture and analyzed by Nanosight (determined in the supernatant obtained after centrifugation at 10,000g). The profile shows that most of the vesicles have a size between 50–200 nm. The insert shows a representative transmission electron microscopy (TEM) image of vesicles obtained from the medium of rat neuronal cultures by centrifugation at 100,000g. (B) The plot compares the size distribution of vesicles present in the medium of 12–14, 15–21 or 22–28 DIV neuronal cultures, determined by Nanosight (n = 11 for 12–14 DIV; n = 11 for 15–21 DIV; n = 6 for 22–28 DIV). (B, C) The plot compares the concentration of vesicles present in the accumulated medium of 12–14, 15–21 or 22–28 DIV neuronal cultures, quantified from the area under the curve of size distribution curves obtained by Nanosight, such as the one shown in panel (B) (n = 8 per group). The graph shows the mean ± SEM. Statistical significance was analyzed by Kruskal–Wallis test (P-value: 0.0164). Post hoc analysis was performed with Dunn’s multiple comparisons test (**P < 0.05; P-value for comparison of 12–14 DIV and 22–28 DIV: 0.0083). (D) The same analysis as in C but for small extracellular vesicles secreted during a 24-h period. (n = 12 for 12–14 DIV; n = 11 for 15–21 DIV; n = 6 for 22–28 DIV). The graph shows the mean ± SEM. Statistical significance was analyzed by one-way ANOVA (P < 0.0001). Post hoc analysis was performed with Dunnet’s multiple comparisons test (****P < 0.0001; P-value for comparison of 12–14 DIV and 22–28 DIV <0.0001). (E) TEM images showing three examples of vesicles observed in the medium of neuronal cultures (analyzed in the pellet obtained by centrifugating the medium pooled from three independent cultures at 100,000g). Below, the plot compares the number of vesicles by size groups (0–50 nm), between 14 DIV and 23 DIV. The quantification was obtained from the analysis of TEM images such as the ones shown above. The graph shows the mean number of vesicles ± SEM. Statistical significance was analyzed by two-way ANOVA (P-value for interaction <0.0001). Post hoc analysis was performed with Sidak’s multiple comparisons test (*P < 0.05; ****P < 0.0001; P-value for comparison of 10–20 nm between 12–14 DIV and 22–28 DIV: P < 0.0001; P-value for comparison of 20–30 nm between 12–14 DIV and 22–28 DIV: 0.0375). (F) Western blot characterization of total lysates and small extracellular vesicles isolated from the medium of 14 and 21 DIV neuronal cultures by ultracentrifugation at 100,000g. The blots were analyzed with antibodies against exosomal markers (HSP90 and CD81), a total tau antibody (Tau5) and an antibody against actin as a loading control.

