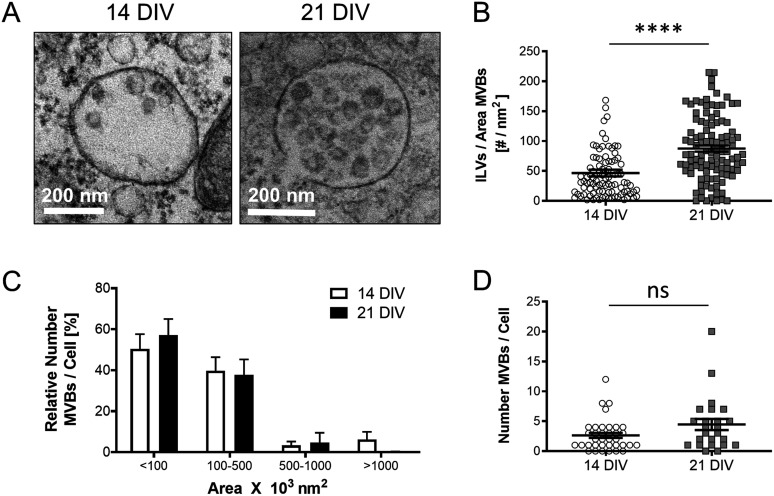
Figure 3. Analysis of multivesicular bodies (MVBs) in cortical neurons during aging in vitro.
(A) Representative transmission electron microscopy (TEM) images of 14 DIV and 21 DIV cortical neurons showing an increased number of ILVs in the lumen of MVBs in 21 DIV neuronal cultures when compared with 14 DIV. (A, B) The plot compares the number of ILVs normalized by the area (nm2) of the MVBs, quantified from TEM images of 14 DIV and 21 DIV neuronal cultures, such as the ones shown in panel (A) (n = 94 MVBs for 14 DIV; n = 107 MVBs for 21 DIV; N = 3 independent neuronal cultures). The graph shows the mean ± SEM. Statistical significance was analyzed by two-tailed Mann–Whitney test (****<0.0001). (A, C) The plot compares the size distribution of MVBs between 14 DIV and 21 DIV neuronal cultures, calculated from TEM images such as the ones shown in panel (A) (n = 31 cells and 101 MVBs for 14 DIV; n = 21 cells and 110 MVBs for 21 DIV; N = 3 independent neuronal cultures). Relative (%) MVBs numbers per each size group and cell are calculated by comparing to the total number of MVBs present in the cell. The graph shows the mean ± SEM. Statistical significance was analyzed by two-way ANOVA (P-value for interaction: 0.7081, ns: non-significant). (D) The plot compares the total number of MVBs per cell between 14 DIV and 21 DIV neuronal cultures. (A) The quantification was done on TEM images such as the ones shown in panel (A) (n = 36 cells for 14 DIV; n = 23 cells for 21 DIV; N = 3 independent cultures). The graph shows the mean ± SEM. Statistical significance was analyzed by two-tailed Mann–Whitney Test (ns: non-significant; P-value: 0.1078, ns).

