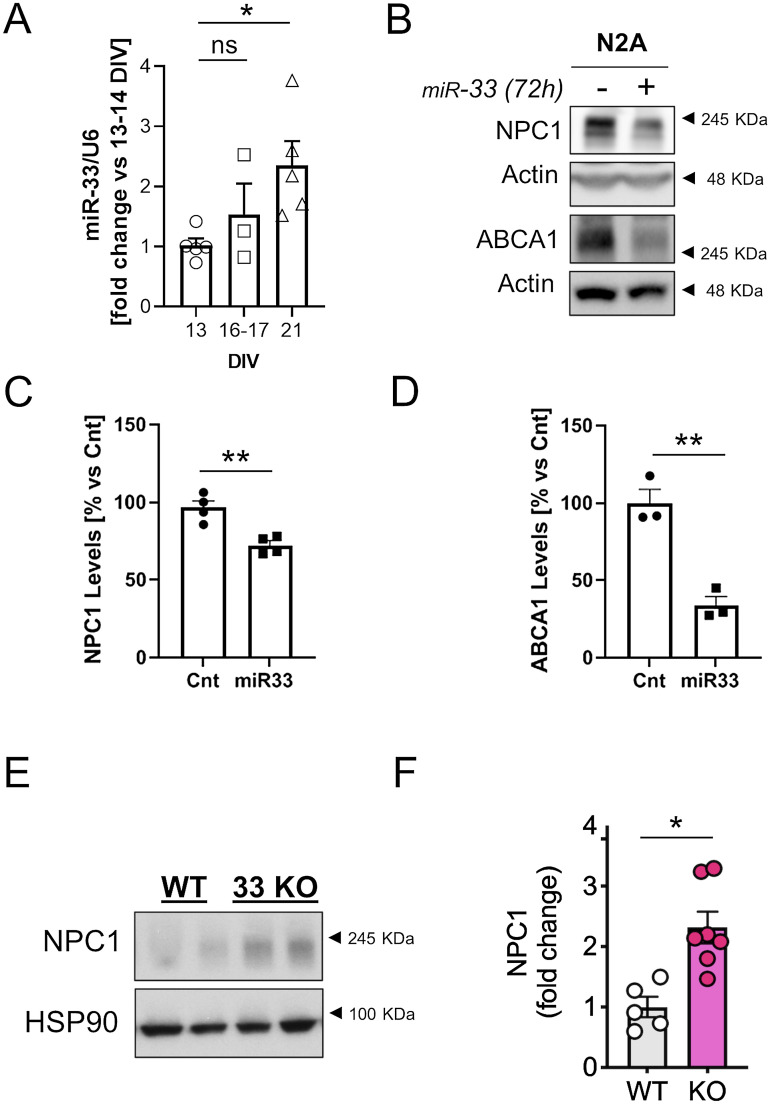
Figure 8. miR33 is up-regulated in aged neurons in vitro.
(A) The plot compares the miR33 levels (normalized by the housekeeping RNA U6) between 13 DIV, 16–17 DIV and 21 DIV neuronal cultures (fold change versus DIV). The microRNA levels were determined by RT–PCR (n = 5 independent culture). The graph shows the mean ± SEM. Statistical significance was analyzed by one-way ANOVA (P-value: 0.0410). Dunnet’s multiple comparisons test was used to compare the 21 DIV and the 16–17 DIV to the 13 DIV group (ns: non-significant; *P < 0.05; P-value for the 21 DIV to 13 DIV comparison: 0.0258). (B) Western blot analysis of lysates of N2A cells transfected with 40 nM of a non-targeting control mimic or 40 nM miR-33 mimic (miRNA-33). The blots were analyzed with antibodies against NPC1, ABCA1 and actin. (C) Plot comparing the relative protein levels of NPC1 between N2A cells transfected with 40 nM of a non-targeting control mimic (n = 4) or 40 nM miR33 mimic (miR-33; n = 4). (B) Blots were quantified from Western blot experiments as the one shown in panel (B). The graph shows the mean ± SEM and individual data points. Statistical significance was analyzed by two-tailed unpaired t test (**P < 0.05). (C, D) The plot compares the ABCA1 protein levels in the same experimental conditions as in panel (C). The graph shows the mean ± SEM and individual data points (n = 3). Statistical significance was analyzed by two-tailed unpaired t test (**P < 0.05). (E) Western blot analysis of brain lysates from 2 mo old WT or miR33 KO mice. Blots were tested with antibodies against NPC1 and HSP90. (F) Plots comparing the relative protein levels for NPC1 in the brain of WT (n = 5) and miR33 KO (n = 7) mice. (C) Protein levels were quantified from Western blot experiments as the one shown in panel (C). The graph shows the mean ± SEM and individual data points. Statistical significance was analyzed by two-tailed unpaired t test (*P < 0.05).

