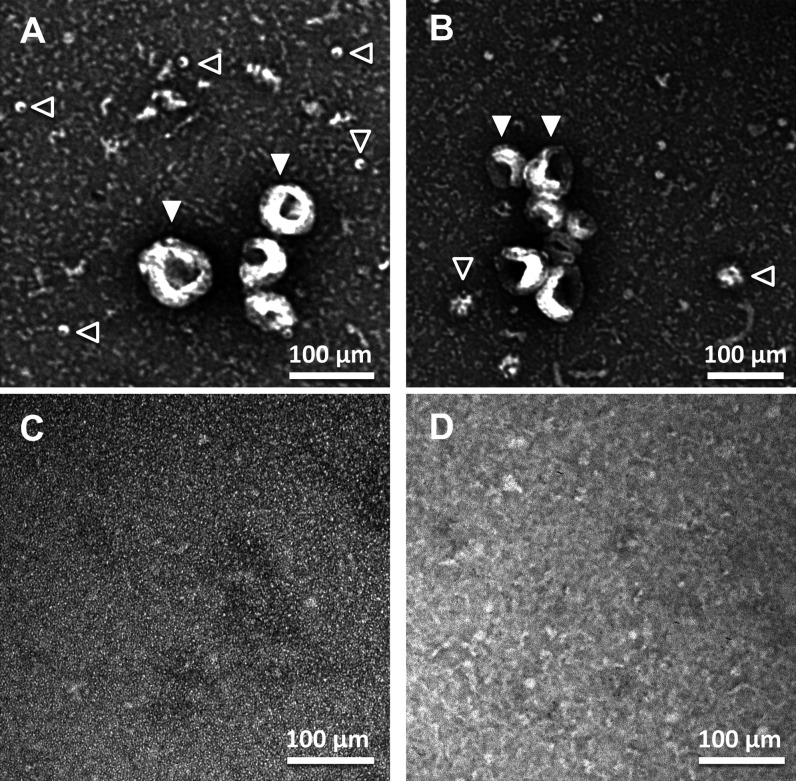
Figure S3. Transmission electron microscopy (TEM) analysis of extracellular vesicles.
(A, B, C, D) Representative TEM images of the pellet obtained after centrifuging the media of neuronal cultures at 100,000g for 2 h (panels A, B) and their respective supernatants (C, D). (A, B, D) Panels (A, B) show vesicles with a size compatible with exosomes (filled arrowheads) and other types of vesicles with smaller sizes (empty arrowhead). (A, B, D) Similar TEM images as the ones shown in panels (A) and (B) were quantified to build the plot shown in panel (D) of Fig 2.

