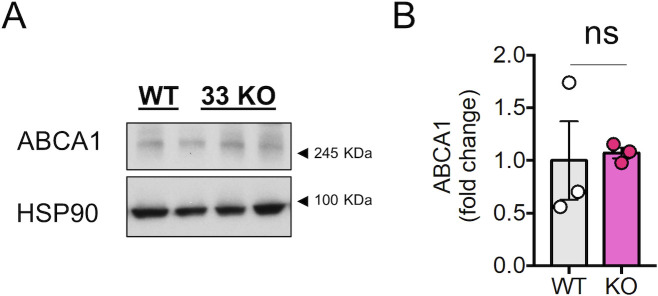
Figure S9. ABCA1 protein levels in the brain of miR33 knockout mice.
(A) Western blot analysis of brain lysates from 2 mo old WT or miR33 KO mice (same animals as in Fig 8C). Blots were tested with antibodies against ABCA1 and HSP90 (same HSP90 blot as in Fig 8C). (B) Plots comparing the relative protein levels for NPC1 in the brain of WT (n = 3) and miR33 KO (n = 3) mice. (A) Protein levels were quantified from Western blot experiments as the one shown in panel (A). The graph shows the mean ± SEM and individual data points. Statistical significance was analyzed by two-tailed unpaired t test (*ns, non-significant). Although the statistical analysis did not reach significance, two of the WT mice show lower levels of ABCA1 in than the KO mice.

