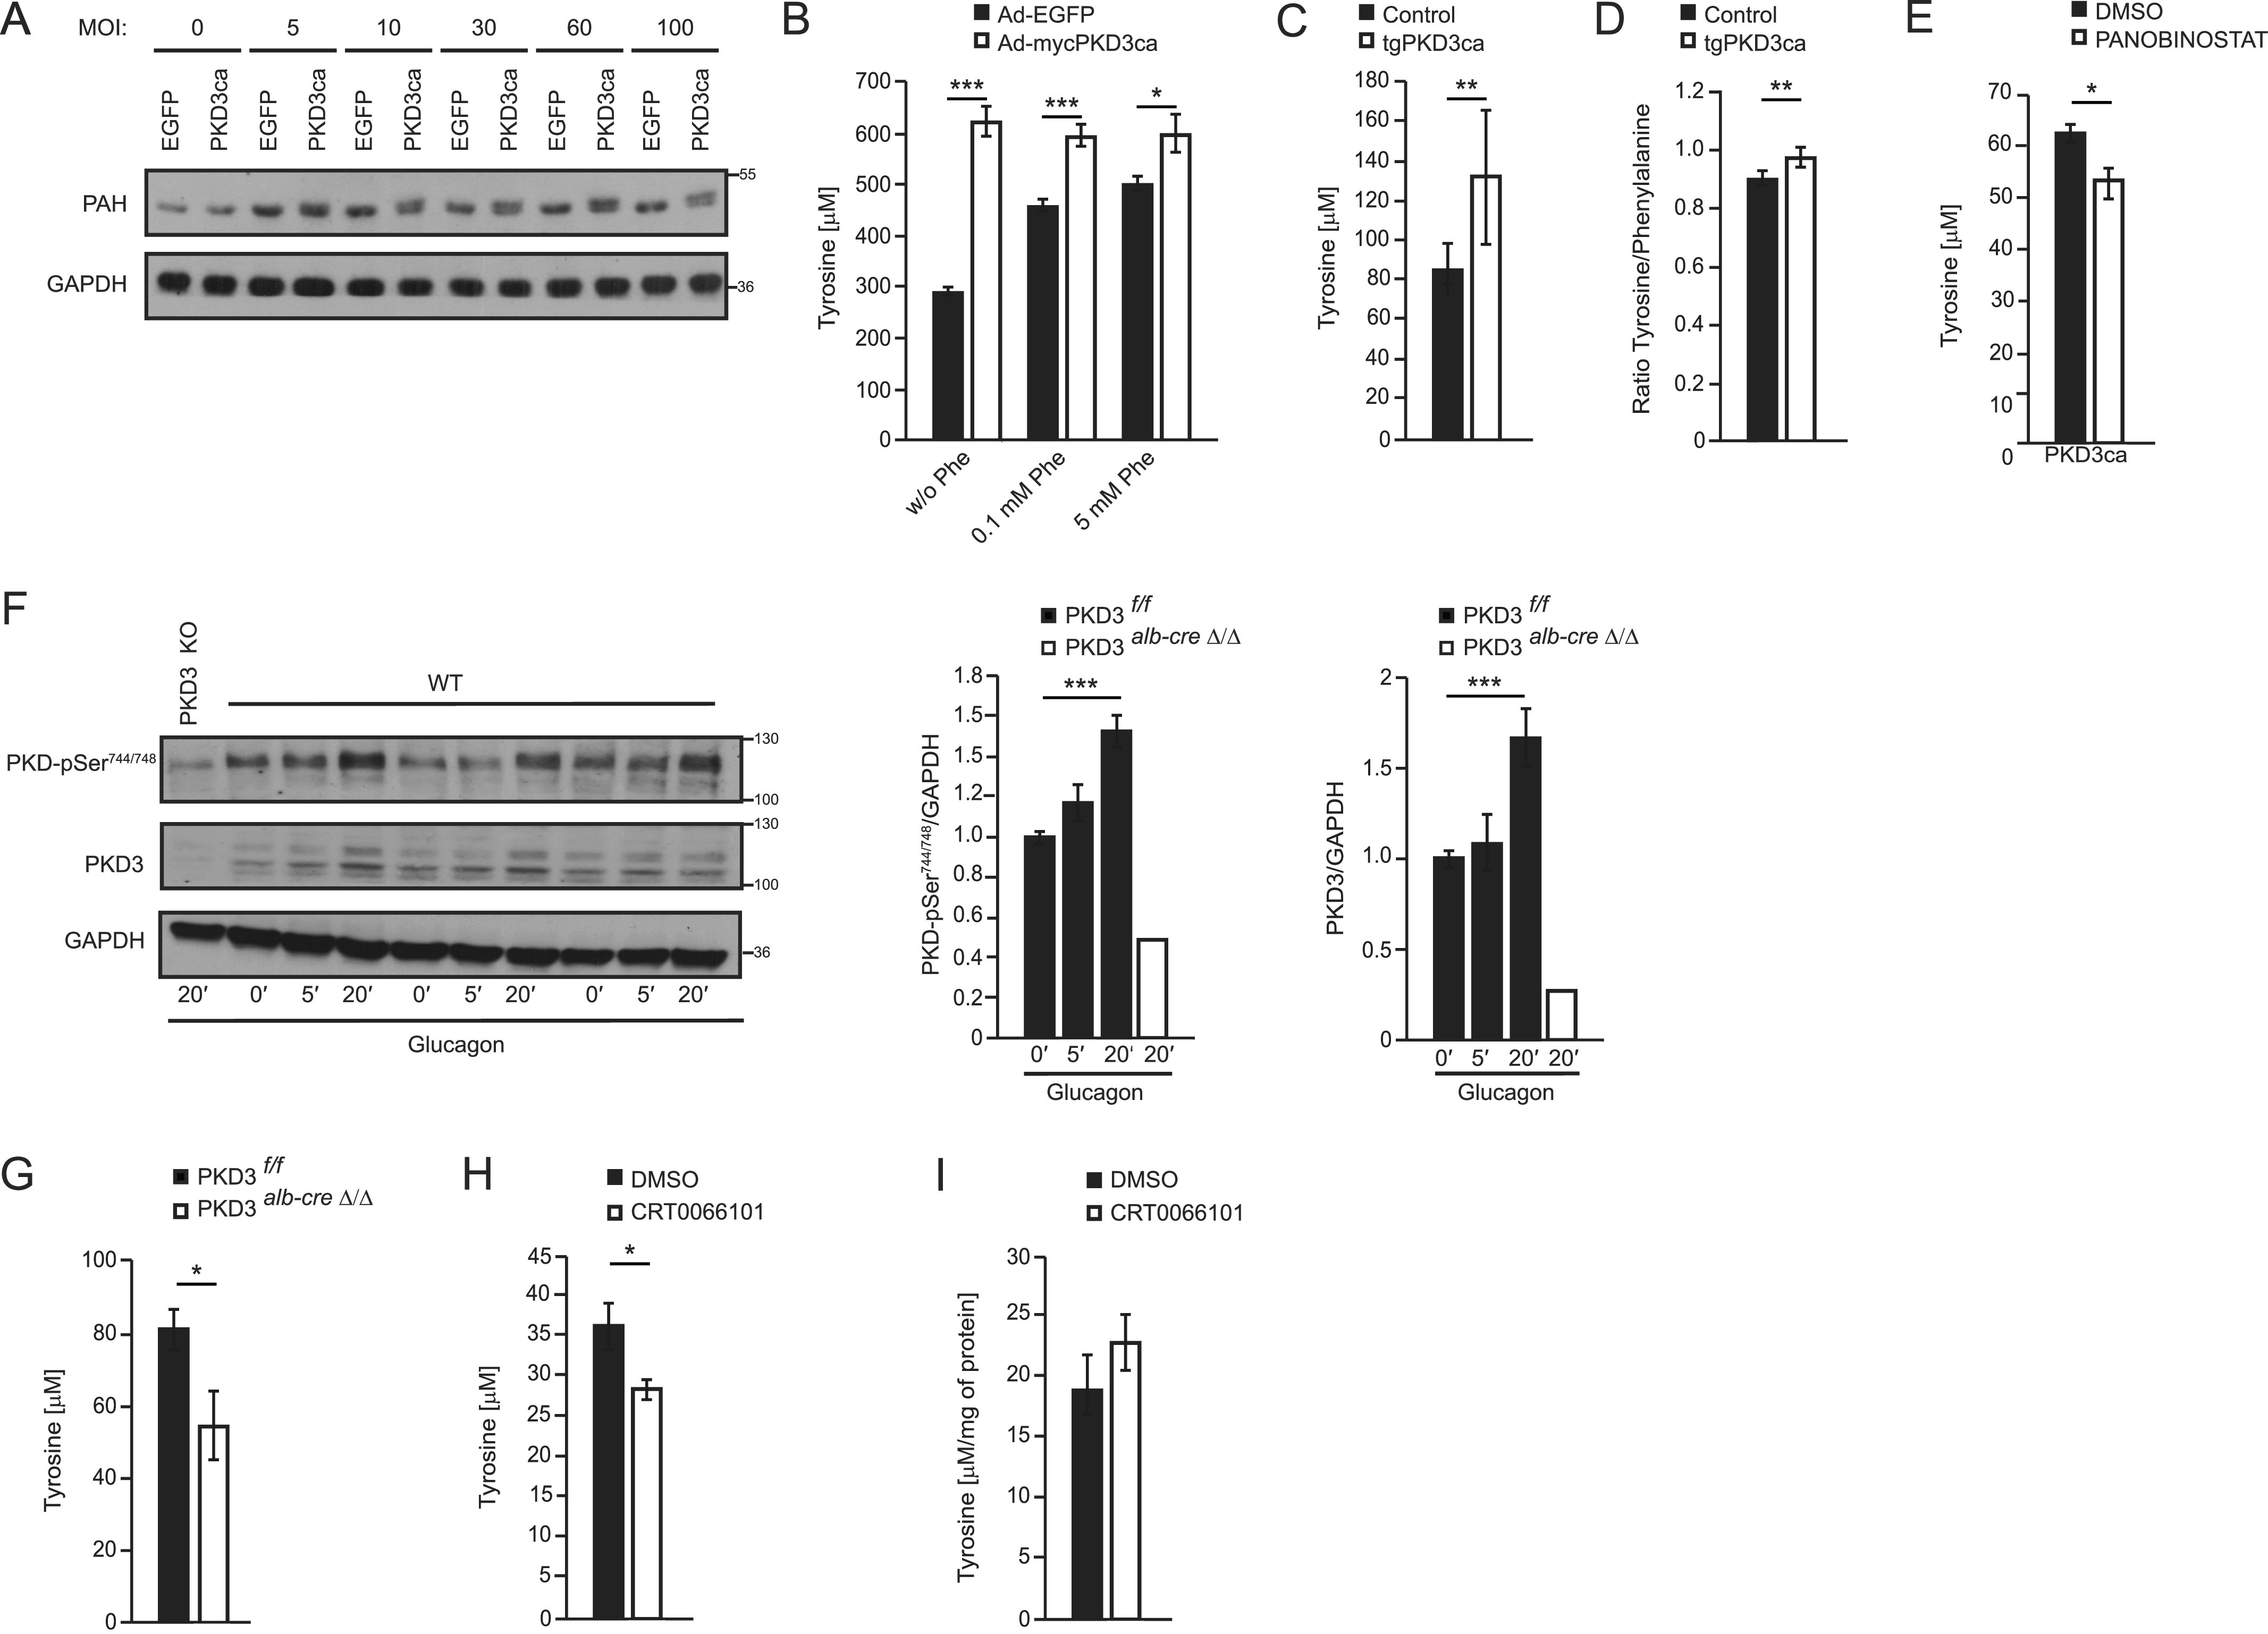
Figure 4. Protein kinase D (PKD)3 signaling controls PAH activity and determines cellular levels of Tyr.
(A) PAH expression and shifting analyzed in hepatocytes transduced with increasing amounts of adenovirus expressing EGFP or PKD3ca at indicated MOIs using WB. (B) Phe to Tyr conversion assay in primary hepatocytes expressing either EGFP or PKD3ca. Cells were depleted from Phe and Tyr in the medium for 1 h before stimulation and incubated with 0, 0.1, or 5 mM Phe for 1 h. (n = 4 per each group) (C) Tyr levels in livers from control mice and mice overexpressing PKD3ca (n = 12 and n = 16). (D) Tyr to Phe ratio in liver tissues from control mice and mice overexpressing PKD3ca (n = 12 and n = 16). (E) Intracellular Tyr levels in hepatocytes overexpressing PKD3ca and treated with Panobinostat 2 μM for 24 h (a PAH inhibitor) as indicated (n = 4) (F) WB analysis of liver extracts isolated from mice fasted for 6 h and stimulated with glucagon at the dose of 200 μg/kg of body weight (i.p. injection) for indicated time points using antibodies against p-PKD, PKD3 (upper band corresponds to the predicted, molecular weight of PKD3), and GAPDH. (G) Tyr levels in primary hepatocytes isolated from control and PKD3-deficient mice and stimulated with glucagon (200 nM) for 20 min. (H) Tyr levels in primary hepatocytes treated with CRT0066101 (1 μM) 2 h prior stimulation with glucagon (200 nM) for 20 min. (I) Tyr levels in the livers of mice treated with CRT0066101 inhibitor for 5 d daily (10 mg/kg of body weight, i.p injection), fasted for 6 h, and challenged with glucagon for 10 min at the dose of 200 μg/kg of body weight (n = 6 per group). Data are presented as mean ± SEM. *P > 0.05, ***P > 0.001 (t test and one-way ANOVA with post hoc Tukey’s test).
Source data are available for this figure.

