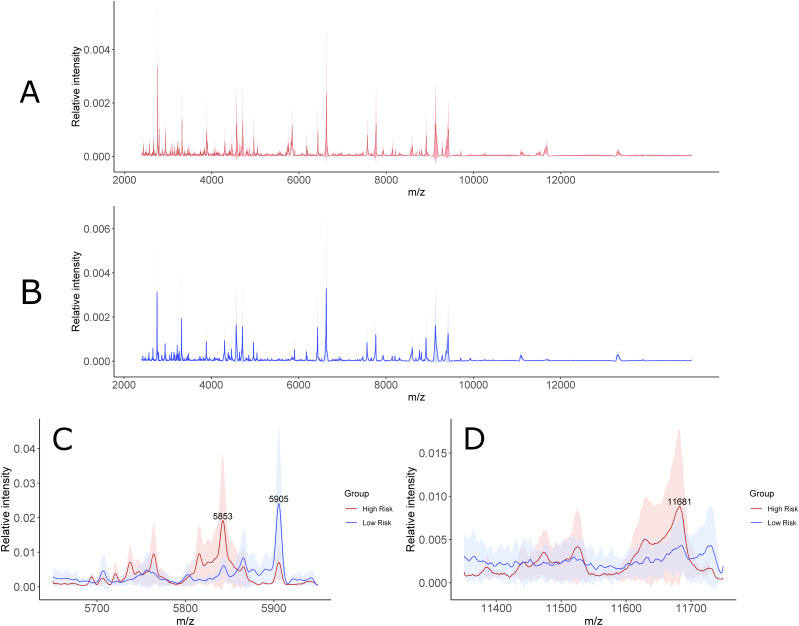
Figure 4. Assessment of sample variability within the low and high-risk groups.
(A) Average mass spectra with the interquartile range (IQR) shaded in red for the high-risk group (A). (B) Average mass spectra with the IQR shaded in blue for the low-risk group (B). (C) Comparison of the average mass spectra with the IQR shaded between the two groups for the most relevant discriminative peaks of “m/z” 5,853–5,905 (C). (D) Comparison of the average mass spectra with the IQR shaded between the two groups for the most relevant discriminative peak at “m/z” 11,681 (D).

