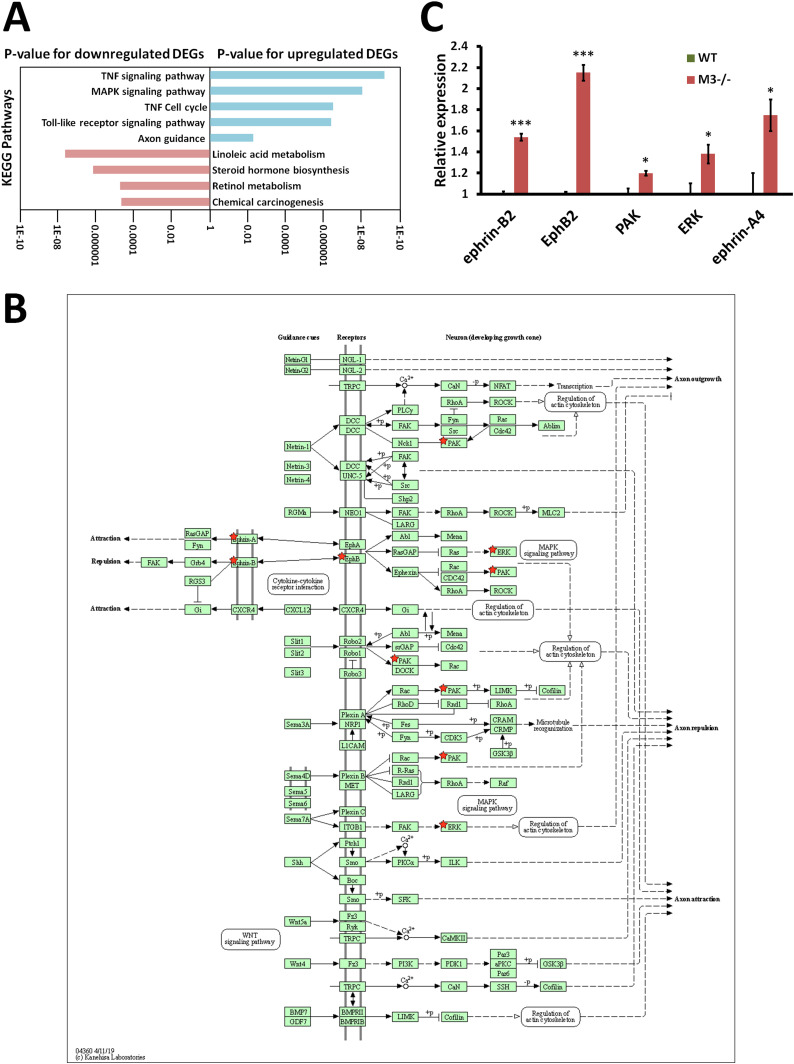
Figure 4. RNA-seq analysis indicates EphB/ephrin-B signaling pathway activation in M3−/− mice.
(A) Database for Annotation, Visualization, and Integrated Discovery analysis of genes differentially expressed in the knockout mice shows a gain of characteristics of proliferation and differentiation and down-regulation of four pathways associated with metabolism. (B) EphB/ephrin-B signaling pathway (mmu04360) maps derived from Database for Annotation, Visualization, and Integrated Discovery analysis. Green boxes and arrows indicate the genes and interactions in the pathway. +p and −p denote phosphorylation and dephosphorylation, respectively. The genes with red stars are those that were up-regulated in M3−/− crypts. (C) Differential expression patterns of ephrin-B2, EphB2, PAK, ERK, and ephrin-A4 in M3−/− crypts. Data information: The results of RNA-seq are based on three independent experiments and are presented as mean values ± SD. The statistical significance was calculated with t test (*P < 0.05 and ***P < 0.0005).
Source data are available online for this figure.

