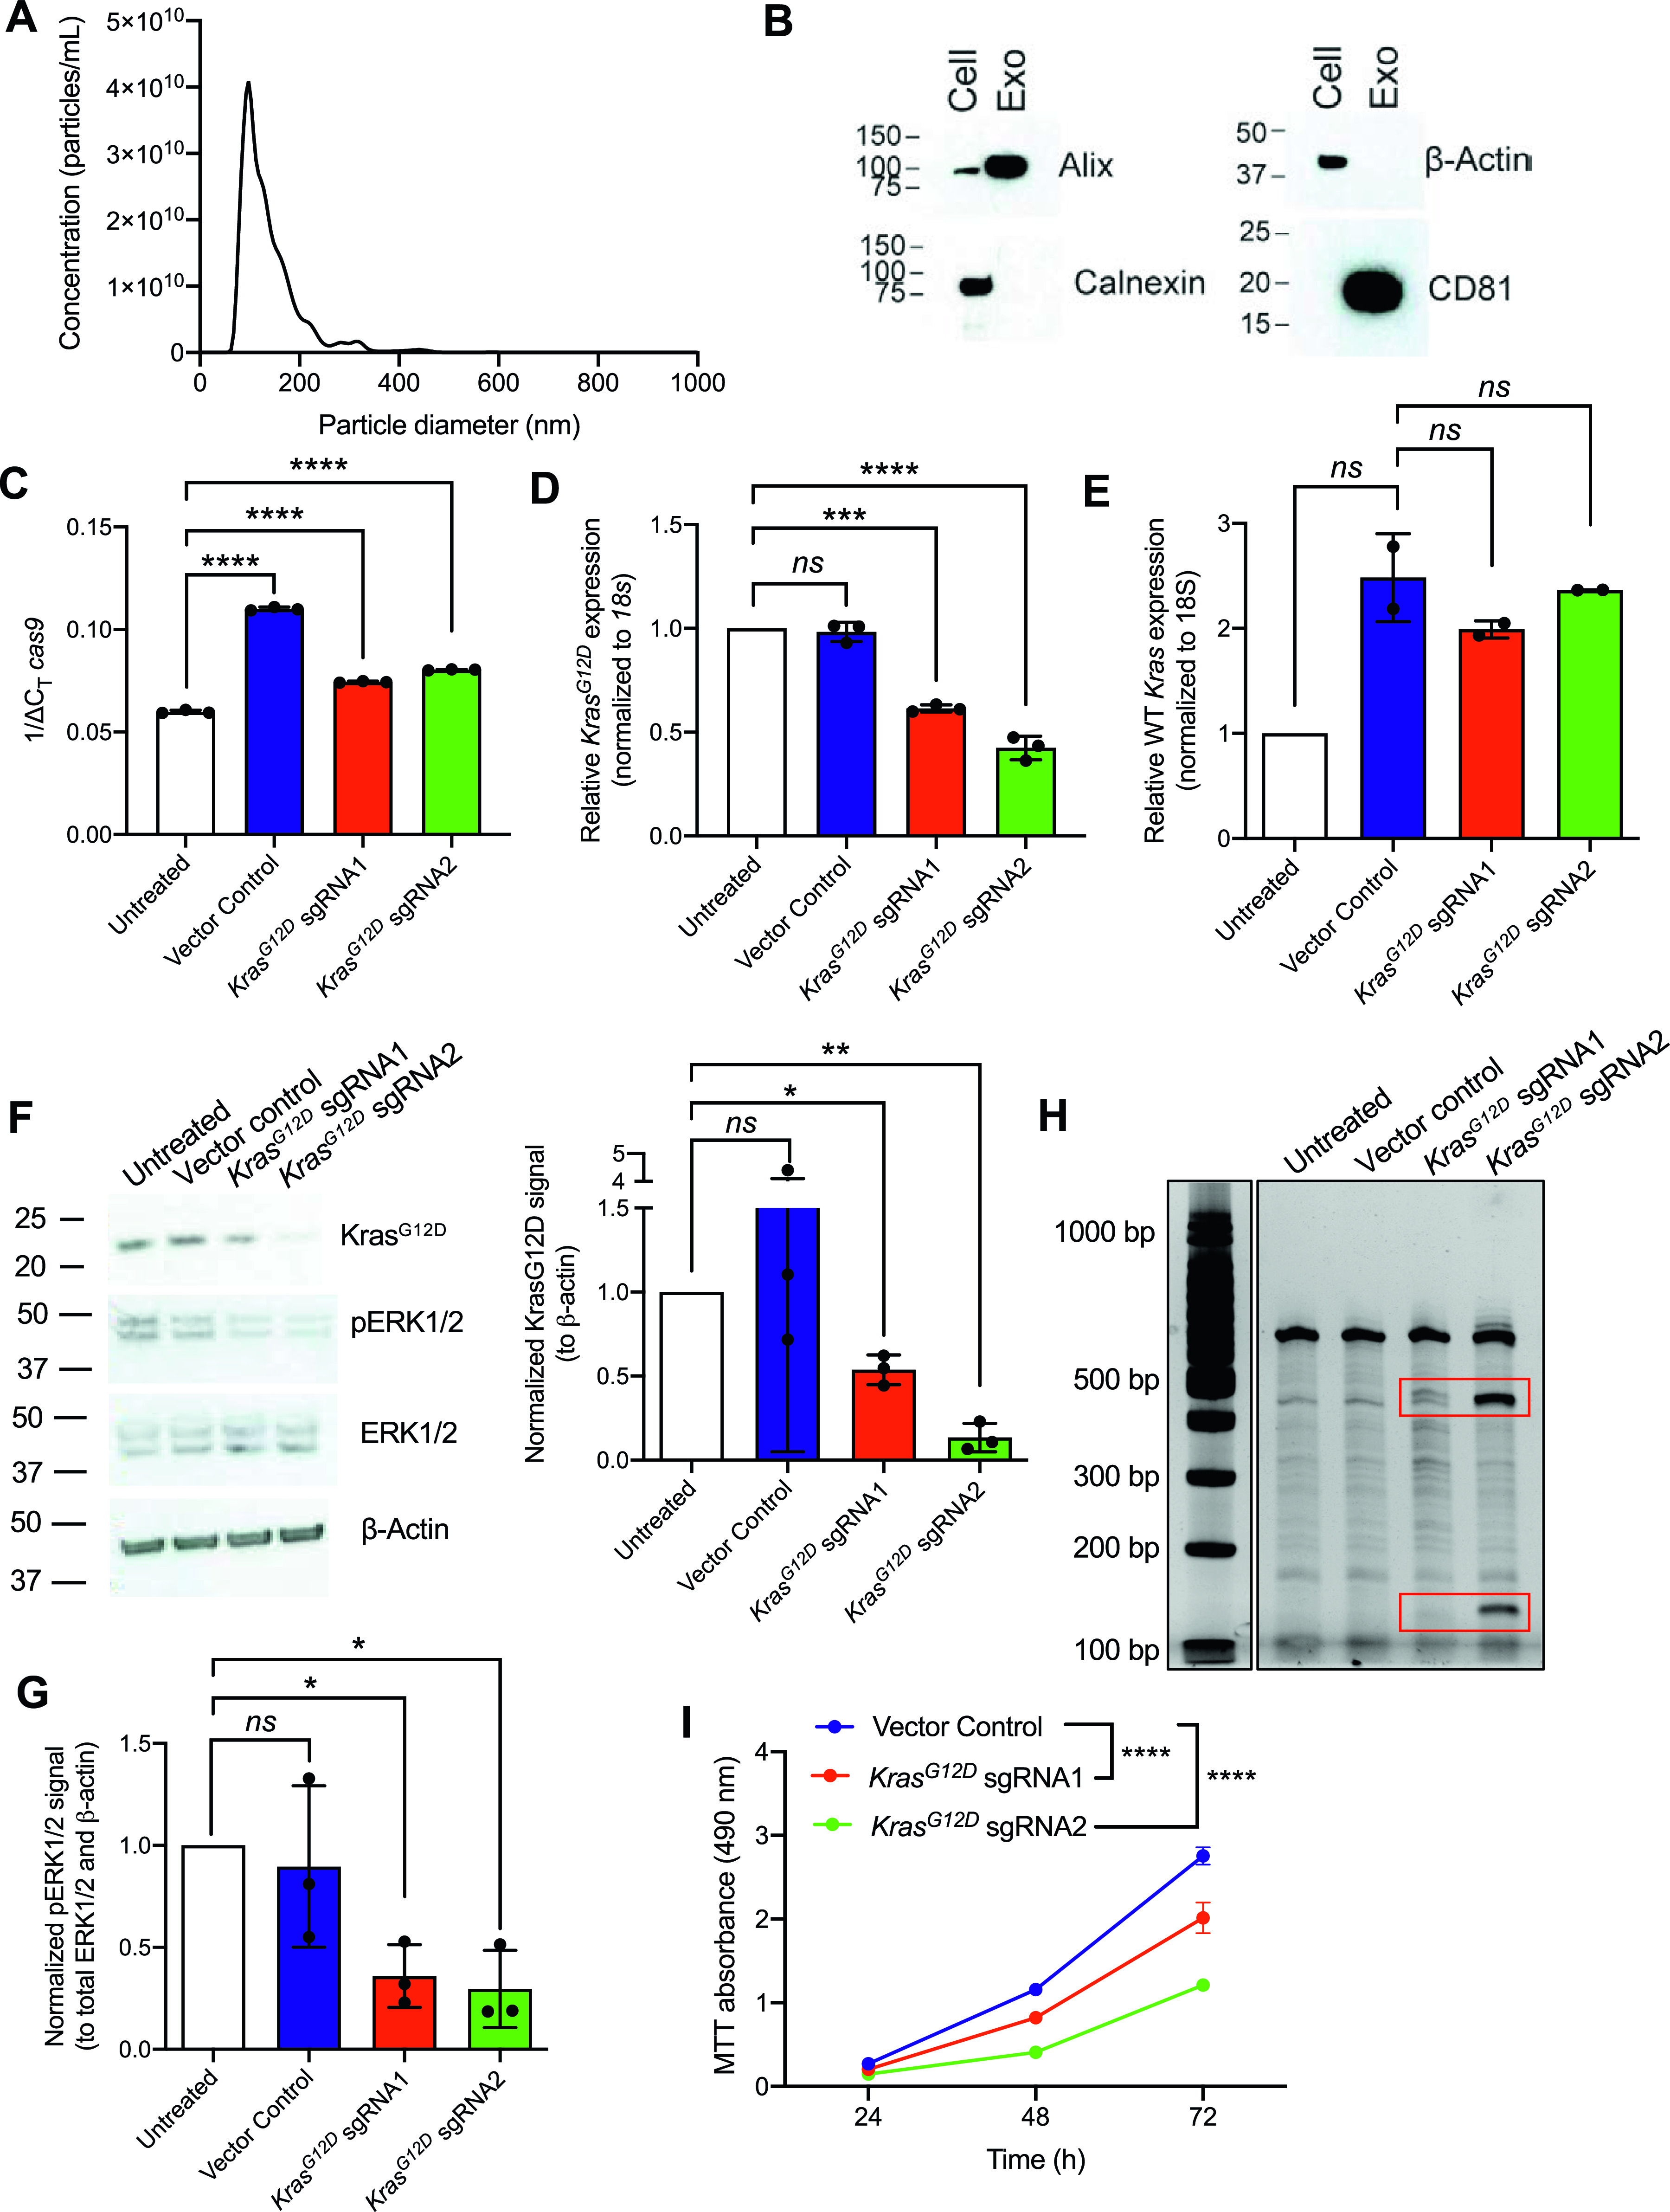
Figure 2.
Exosome-mediated delivery of CRISPR/Cas9 disrupts oncogenic KrasG12D in vitro and inhibits proliferation. (A) Representative size distribution and concentration of HEK293T exosomes measured by nanoparticle tracking analysis. (B) Representative Western blot for exosome markers Alix and CD81 and exclusion markers calnexin and β-actin. Cell, HEK293T cell lysate; Exo, HEK293T exosomes. (C, D, E) Quantitative PCR was used to evaluate mRNA expression levels of cas9 (C), KrasG12D (D), and WT Kras (E) of KPC689 cells treated with HEK293T exosomes (2,500 exosomes/cell) containing plasmid DNA (10 μg DNA/109 exosomes) every day for 3 d. (C) Data in (C) are normalized to 18s. (D, E) Data in (D, E) are normalized to 18s and untransfected control. (C, D) One-way ANOVA with Tukey’s multiple comparisons test was used to evaluate mean differences among groups based on ΔCT values for (C, D). (E) Brown–Forsythe ANOVA with Dunnett’s T3 multiple comparisons test was used to evaluate mean differences among groups based on ΔCT values for (E). (F) Western blot for KrasG12D, pERK1/2, total ERK1/2, and β-actin (left panel) of KPC689 cells following treatment with exosomes containing CRISPR/Cas9 plasmid DNA. Quantification of KrasG12D (normalized to β-actin) as assessed via Western blot (right panel). Data are normalized to untreated. One sample t test performed comparing each group to untreated. Full length blots are presented in Fig S3A. (G) Quantification of phospho-ERK1/2 (normalized to total ERK1/2 and β-actin) as assessed via Western blot (right panel). Data are normalized to untreated. One sample t test performed comparing each group to untreated. Full length blots are presented in Fig S3A. (H) T7/Surveyor assay was used to evaluate editing in genomic DNA of KPC689 cells. (I) MTT assay was used to evaluate cell viability/proliferation rates in KPC689 over the course of 72 h following treatment with exosomes loaded with CRISPR/Cas9 plasmid DNA. Two-way ANOVA with Tukey’s multiple comparison test was performed. Data are expressed as mean ± standard deviation. ***P < 0.001, ****P < 0.0001, ns, not significant.
Source data are available for this figure.