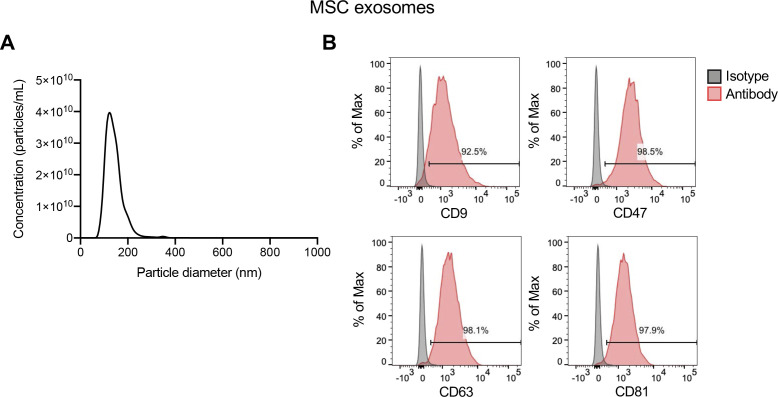
Figure S5. Characterization of mesenchymal stem cell (MSC) exosomes.
(A) Representative nanoparticle tracking analysis plot of MSC exosomes. (B) Representative histogram of flow cytometry analyses of exosomal surface markers (CD9, CD47, CD63, and CD81, indicated in red; isotype control indicated in gray) on MSC exosomes bound to beads. Numbers represent the percentage of positive beads.
Source data are available for this figure.

