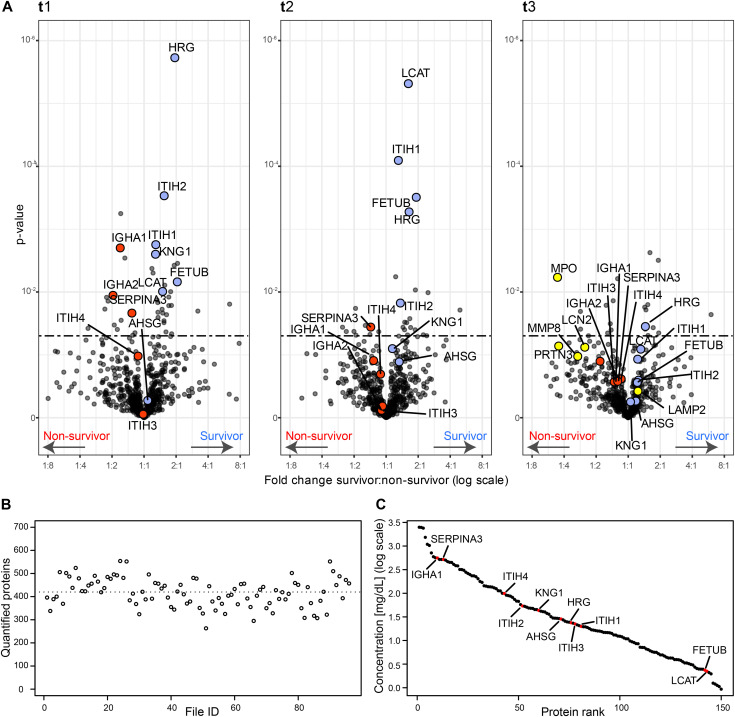
Figure 2. Serum proteins that are differentially abundant in survivors and non-survivors per time point.
(A) Volcano plots showing the fold change and associated P-values. For each time point t1, t2, and t3, a two-sided t test was performed to identify the significance of the differentially abundant serum proteins (significance threshold at P-value 0.05 indicated as dashed line). Proteins discussed here are represented in red if higher in deceased patients and in blue if showing an increase in surviving patients. In the Volcano plot of t3, some proteins of neutrophil origin are highlighted in yellow. (B) The number of quantified proteins per sample, with the dotted line indicating the mean (452 proteins quantified on average). (C) The quantitative MS-based data converted to the concentration scale for the 150 abundant serum proteins that are identified and quantified in all samples. Proteins we discuss as potentially stratifying survivors and non-survivors are marked in red (AHSG, FETUB, KNG1, HRG, ITIH1, ITIH2, LCAT, SERPINA3, IGHA1, IGHA2, ITIH3, and ITIH4) and thus span the entire covered dynamic range.

