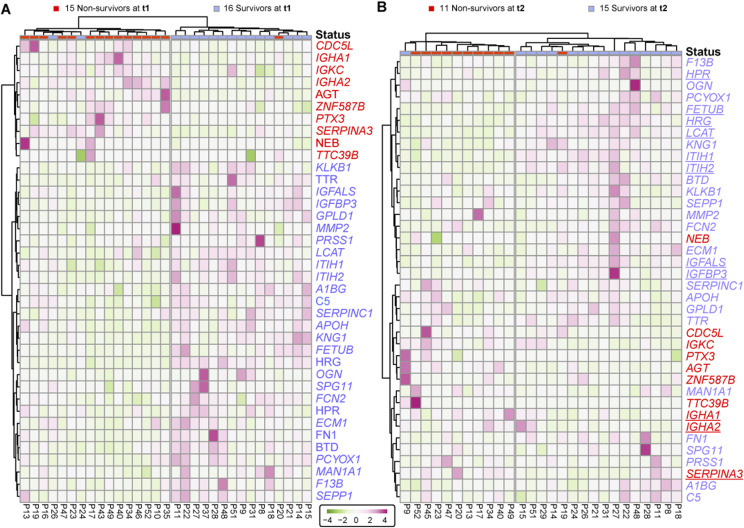
Figure 3. Surviving and non-surviving SARS-CoV-2 patients can be distinguished by a small panel of abundant serum proteins, already at t1.
(A) Proteins identified as differentially abundant at time point 1 are shown here to completely cluster samples with respect to patient outcome (16 survivors versus 15 non-survivors at time point 1). Proteins are annotated by their gene names, and those indicated in blue show higher concentrations in survivors, whereas proteins in red show higher concentration in non-survivors. (A, B) The differentially abundant proteins at time point 1 (as shown in (A)) are used to distinguish the 15 survivors from 11 non-survivors at time point 2. (B) Underlined proteins in (B) designate the proteins that were found to be regulated at both time points. Although the cohort consisted of 17 survivors and 16 non-survivors, at each time point, we missed for a few patients a blood sampling point, which then also could not be included in the clustering and is indicated at the top of the dendrograms.

