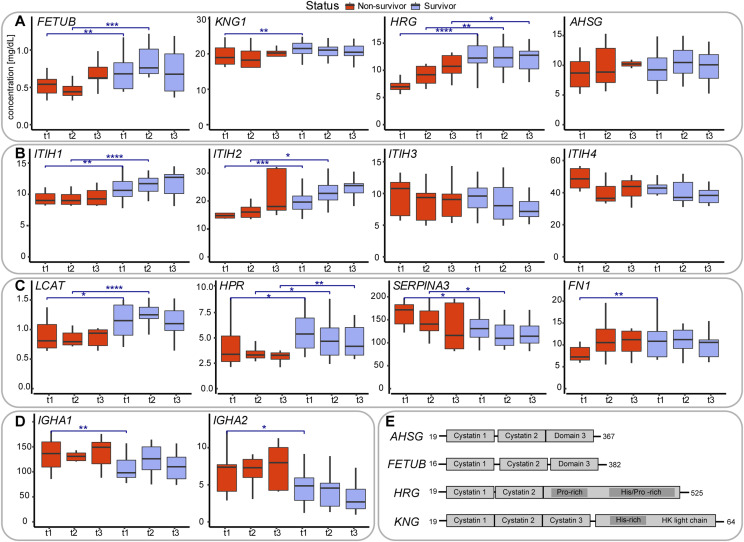
Figure 4. Serum abundance and structural and functional description of proteins being differentially abundant in survivors versus non-survivors.
(A) Serum abundance estimates, based on MS-based label-free quantification (Fig S2), of the four type-3 cystatins, comparing survivors (blue) with non-survivors (red). At each time point the abundance of these cystatins is higher in the survivors compared to the non-survivors. Comparisons between survivors and non-survivors at respective time points are denoted as significant using asterisks: *P ≤ 0.05, **P ≤ 0.01, ***P ≤ 0.001, and ****P ≤ 0.0001. (B) Serum abundance of the four abundant inter-α-trypsin inhibitors (IαI), with clear opposing trends between ITIH1 and ITIH2 as well as between ITIH3 and ITIH4. At each time point the abundance of ITIH1 and ITIH2 is higher in the survivors compared to the non-survivors, whereas for ITIH3 and ITIH4 the opposite holds. (C) Serum abundance of other putative mortality indicators: phosphatidylcholine-sterol acyltransferase (LCAT), HPR, alpha-1-antichymotrypsin (SERPINA3), and fibronectin (FN1). (D) Profiles of the IgA immunoglobulin variants IgA1, IgA2, both less abundant in survivors. (E) Schematic domain-structures of the type-3 cystatins showing their sequence homology. Cystatin domains as well as His/Gly and His/Pro domains are depicted as boxes.

