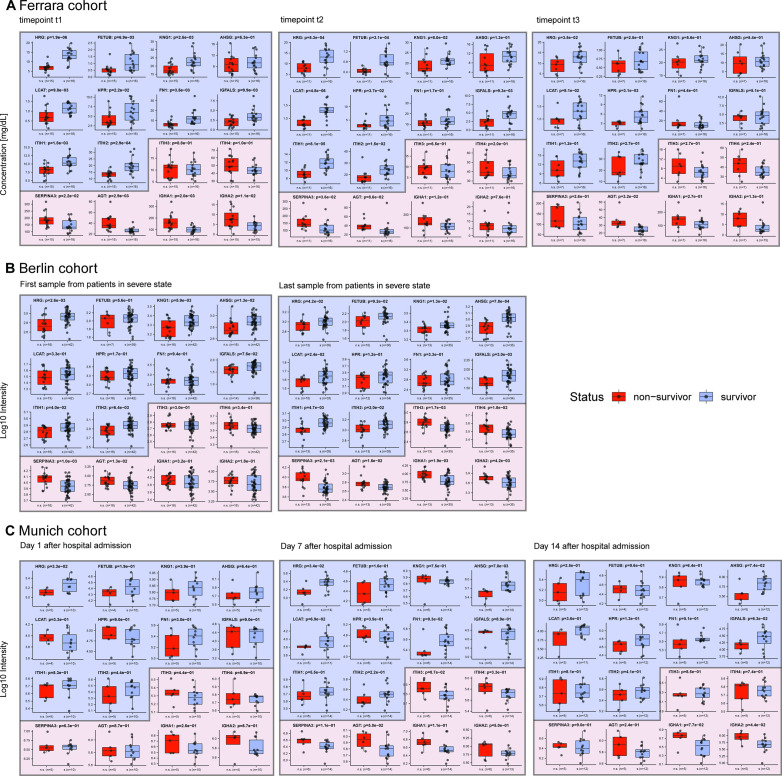
Figure S5. Comparison of the abundance of 16 protein in the serum from survivors versus non-survivors in our Ferrara cohort, as well as in two independent cohorts; Berlin and Munich.
(A) Protein abundance in survivors versus non-survivors from the data generated in this study shown side-by-side, at time points t1, t2, and t3, respectively. (B) Serum protein abundances in survivors and non-survivors in a cohort of patients in Berlin analyzed by Demichev et al. To make a proper comparison with our data, we selected from this cohort patients at WHO ≥ 6 (invasive mechanical ventilation) and data from the first and last time point. The last time point is the day of death for some of the patients. (C) For the Munich-based cohort (data from Geyer et al) we selected the data from patients that were tested positive for COVID-19, and chose to include time points corresponding to 1, 7, and 14 d after admission to the hospital. (C) The result of our re-analysis of already published data results in slightly different values, due to a different subset of patients retained for significance testing and therefore a different test setup. Indeed, for the data depicted in (C), the number of non-survivors is rather small in comparison with the number of survivors, resulting in weaker significance. Despite these shortcomings, we observe that using data taken at a single time point it is already feasible to predict mortality with a small panel of proteins in all these three different cohorts.

