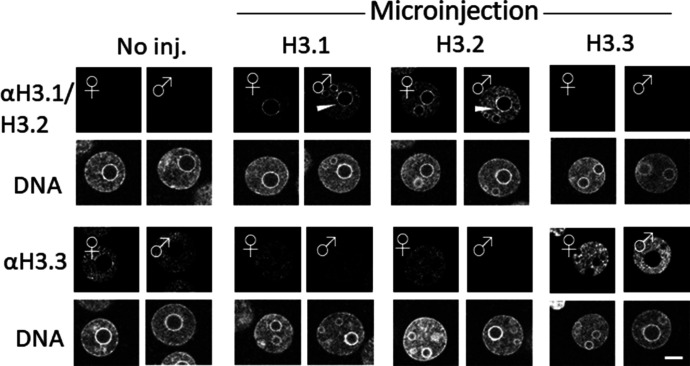
Figure 3. Fluorescence images depicting the effects of H3.1/2 and H3.3 overexpression on H3 variant nuclear localization in one-cell embryos.
Noninjected control, H3.1-, H3.2-, and H3.3-overexpressing one-cell embryos at 11 h post-insemination (hpi) were fixed and examined for changes in the nuclear localization of H3.1/2 and H3.3, using anti-H3.1/2 and anti-H3.3 antibodies, respectively. Eight independent experiments were performed and 39–58 total embryos were examined. Representative images are shown for each experiment. White arrowheads indicate the presence of H3.1/2 in the perinucleolar region of the paternal pronuclei. Scale bar, 10 μm.

