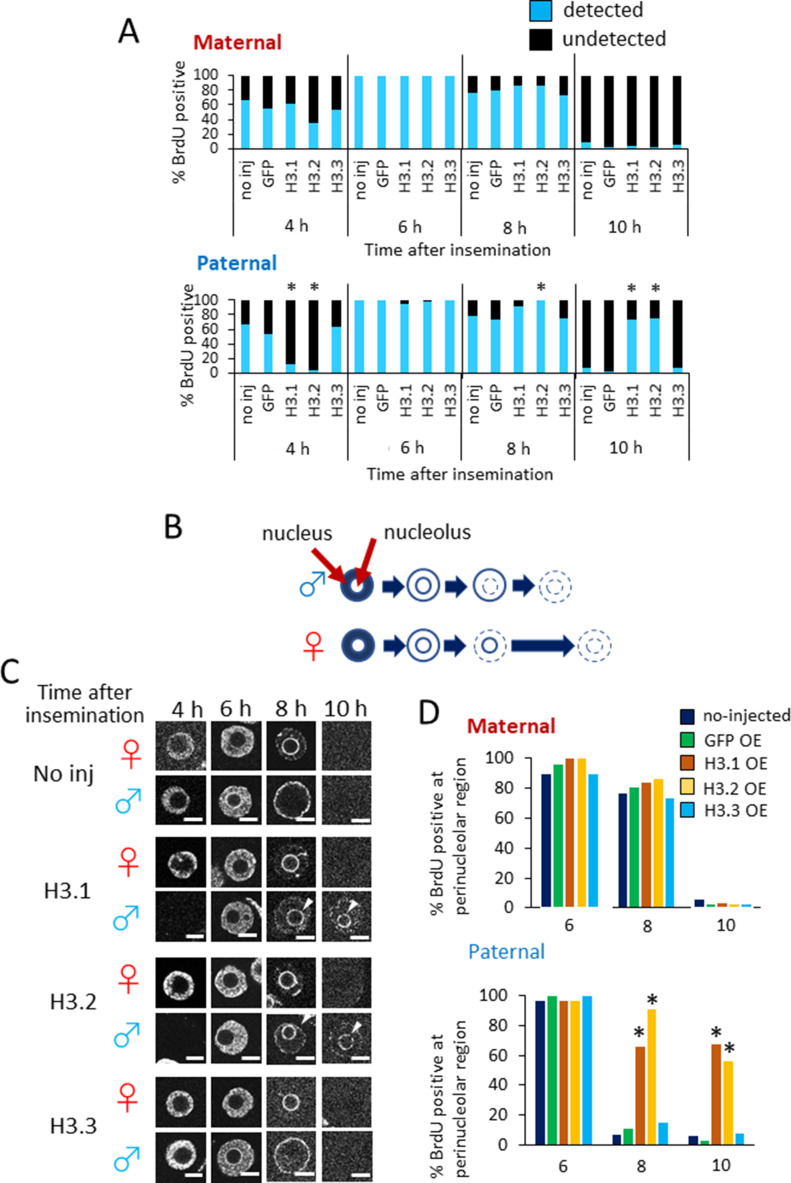
Figure 5. Timing of DNA replication in noninjected, GFP-, H3.1-, H3.2-, and H3.3-overexpressing embryos.
(A) The incorporation of BrdU was analyzed at 4, 6, 8, and 10 h post-insemination (hpi). Three to five independent experiments were performed. For each injected or noninjected sample, 30–51 embryos were analyzed in total. Asterisks represent statistical significance in the following analyses: for H3.1- and H3.2-overexpressing embryos (OEs), a χ2 test or Fisher’s exact test was performed and the results were considered significant when P < 0.01 for noninjected, GFP-, and H3.3-OEs; for H3.3-OEs, a χ2 test or Fisher’s exact test (when there was a group in which the value was below 5) was performed and the results were considered significant when P < 0.01 for noninjected and GFP-OEs. (B) Illustration of asymmetrical DNA replication in paternal and maternal pronuclei in one-cell embryos (Aoki & Schultz, 1999). DNA replication begins in the intranuclear region in both parental pronuclei. In the paternal pronucleus, DNA replication occurs first in the perinucleus, then in the perinucleolar region. In the maternal pronucleus, DNA replication in the perinucleolar region is completed after the paternal pronucleus has completed its replication. (C) Confocal images showing the patterns of BrdU incorporation in maternal (♀) and paternal (♂) pronuclei in noninjected, H3.1-, H3.2-, and H3.3-OEs at 4–10 hpi. For each injected or noninjected sample, 30–51 embryos were analyzed. Three to five independent experiments were performed. Representative images are shown for each experiment. Arrowheads indicate the presence of DNA replication at perinucleolar region in the paternal pronuclei of H3.1- and H3.2-OEs at 8–10 hpi. Scale bar, 10 μm. (D) Bar graph depicting %BrdU-positive perinucleolar regions for each microinjection condition at 6, 8, and 10 hpi. Three to four independent experiments were performed. For each sample, 19–51 embryos were analyzed in total. Asterisks represent the significant differences when compared with noninjected and GFP-OE embryos (P < 0.01, χ2 test).

