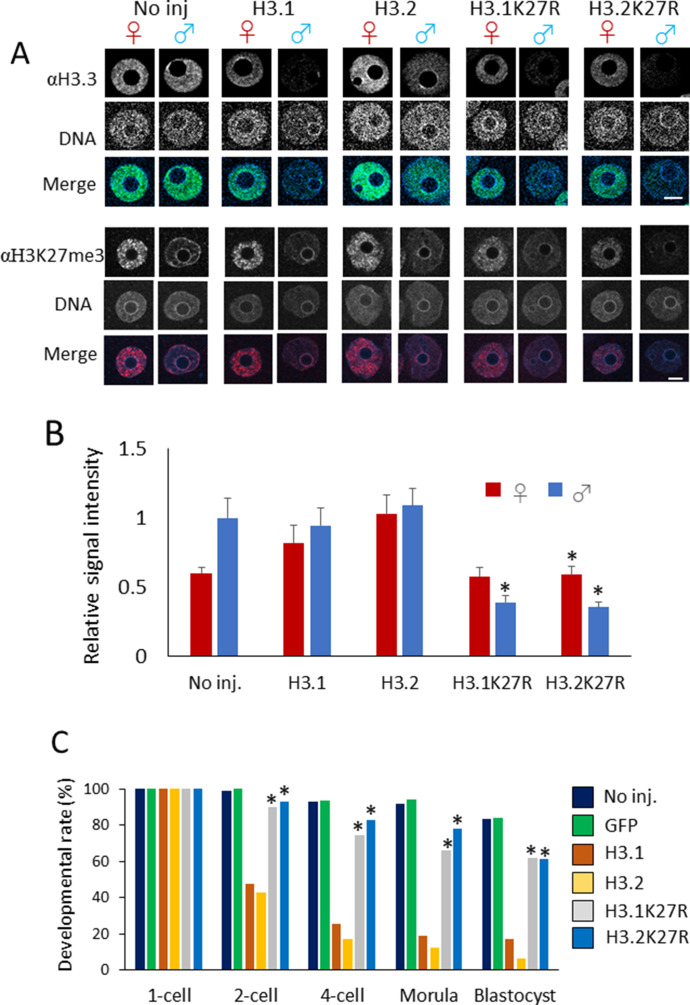
Figure 7. Involvement of H3K27me3 modification on H3.1/2 in the developmental failure observed in H3.1- and H3.2-overexpressing embryos.
(A) Confocal images of noninjected, H3.1/2-overexpressing, and H3.1/2K27R-overexpressing embryos stained with anti-H3.3 and anti-H3K27me3 antibodies. Three (αH3.3) or four (αH3K27me3) independent experiments were performed; 17–25 embryos (αH3.3) or 37–38 embryos (αH3K27me3) were analyzed in each experimental group. Representative images for each experiment are shown. Scale bar, 10 μm. (B) Bar chart showing the relative signal intensity for detected H3K27me3. H3K27me3 levels in the perinucleolar region were measured in noninjected, H3.1-, H3.2-, H3.1K27R-, and H3.2K27R-overexpressing embryos. Three independent experiments were performed; 27–31 embryos were analyzed in each experimental group. H3K27me3 signal measured at three perinucleolar sites and two background sites was used to quantify the signal intensity of H3K27me3 in the perinucleolar region for each pronucleus. The averaged signal intensity for H3K27me3 of male pronuclei in noninjected embryos was normalized to 1. Bars indicate standard error. Asterisks indicate significant differences in relative H3K27me3 signal intensity between H3.1K27R- or H3.2K27R-overexpressing embryos and H3.1- and H3.2-overexpressing embryos (P < 0.01, t test). (C) Bar graph showing the developmental rates of noninjected, GFP-, H3.1-, H3.2-, H3.1K27R-, and H3.2K27R-overexpressing embryos. Five independent experiments were performed and 98–128 embryos were analyzed in total for each experimental group. Asterisks represent significant differences between developmental rates of H3.1K27R/H3.2K27R-overexpressing embryos and H3.1/H3.2-overexpressing embryos (P < 0.01, χ2 test).

