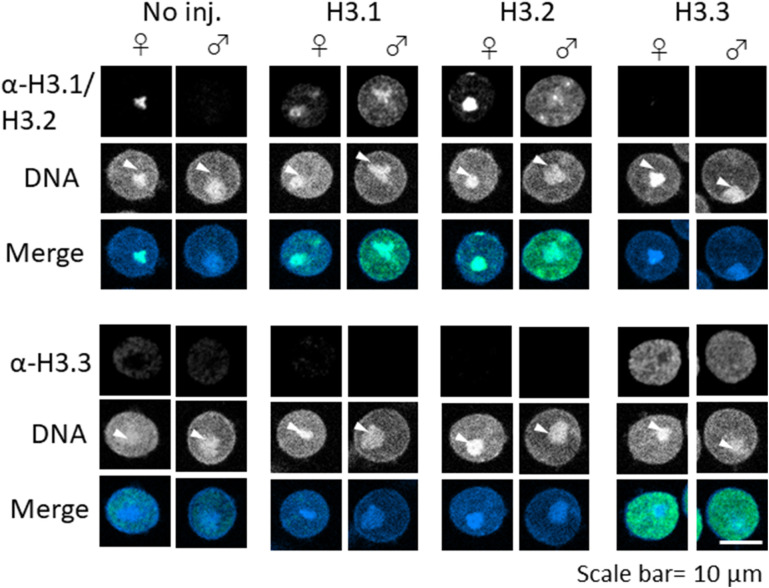
Figure S4. Detection of incorporated H3.1/2 and H3.3 in chromatin of H3.1-, H3.2-, and H3.3-overexpressing one-cell embryos.
Embryos were collected at 11 h post-insemination and permeabilized with 0.5% Triton X-100 before fixation. Levels of H3.1/2 and H3.3 incorporation into chromatin were analyzed with immunocytochemical techniques as previously described (Hajkova et al, 2010), using anti-H3.1/2 and anti-H3.3 antibodies, respectively. As shown, the pronucleolar structure collapsed because of the Triton X-100 treatment; the perinucleolar region is represented as a dot (arrowhead). Four (anti-H3.1/2) or 5 (anti-H3.3) independent experiments were performed. 3–13 embryos were observed for each experimental group; 26–40 embryos in total. Scale bar, 10 μm.

