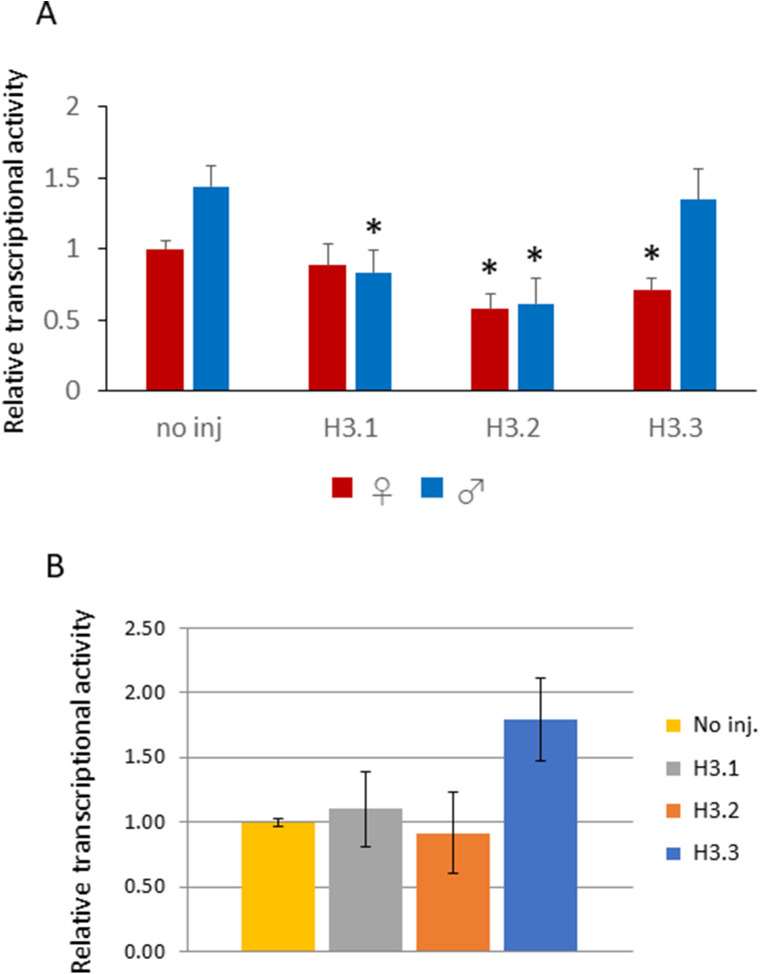
Figure S7. Transcription in H3.1- and H3.2-overexpressing embryos.
(A) One-cell embryos were injected with 100 ng/µl of H3.1, H3.2, or H3.3, then collected at 11 h post-insemination. An in vitro transcription assay using BrUTP was performed, and nuclear BrU signals were quantified using ImageJ software (NIH). Background signal was calculated by averaging signal intensity of two cytoplasmic regions, and then subtracted from the BrU signal intensity of the pronuclei; signal intensity was then corrected using the DAPI signal. Two independent experiments were performed; 3–9 embryos were observed per experimental group, with a total of 11–13 embryos for each injection condition. Error bars indicate standard error. Asterisks indicate that values obtained for H3.1-, H3.2-, and H3.3-overexpressing embryos are significantly different from the values of noninjected control embryos (P < 0.01, t test). (B) One-cell embryos were injected with 100 ng/µl H3.1, H3.2, or H3.3, then collected at 12 h post-insemination. Major satellite repeat expression was analyzed by real-time PCR (RT-PCR) and expression levels were normalized to rabbit α-globin (external control). Three independent experiments were performed, with 18, 20, and 19 embryos collected for the first, second, and third experiments, respectively. Expression of major satellite in noninjected embryos was normalized to 1; the relative expression was calculated for other conditions.

