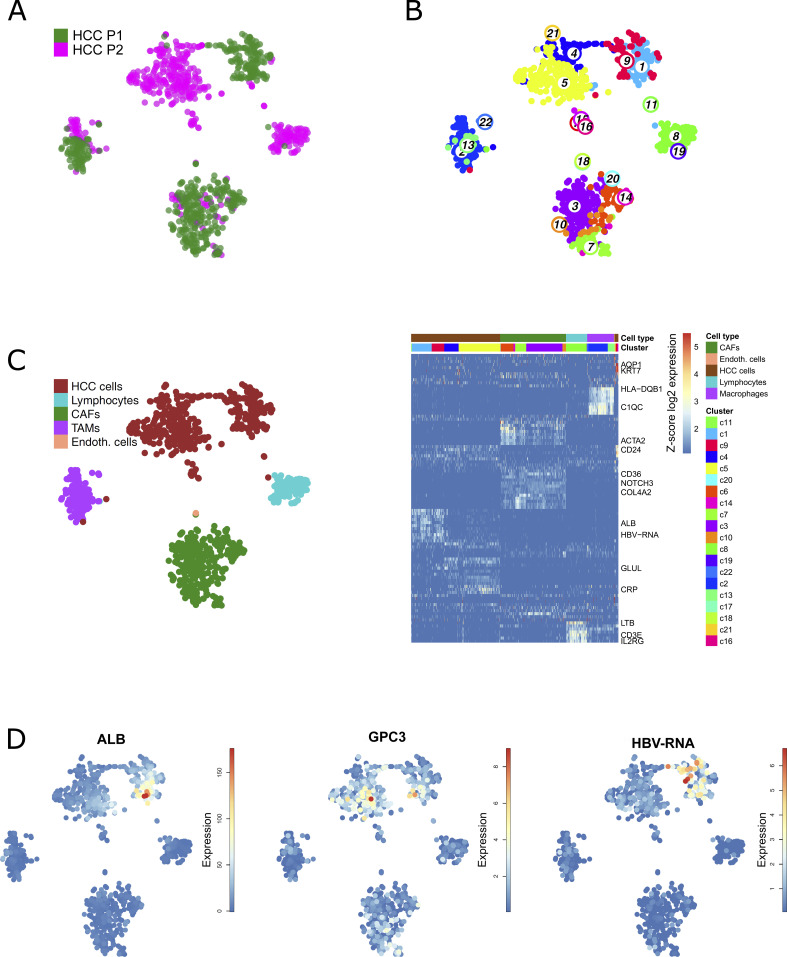
Figure 1. Single-cell RNA sequencing of well- and moderately differentiated HCC.
(A) t-SNE map of well-differentiated (HCC P1) and moderately differentiated HCC (HCC P2). (B) Unsupervised k-medoids clustering of all single cells resulted in 22 clusters. (C) Cell-type annotation using known markers according to Aizarani et al (2019). (B) A t-SNE map (left) shows main cell type annotations as identified according to marker gene expressions as highlighted in the heat map (right). Colors indicating cell clusters refer to (B). (D) Expression t-SNE of albumin (ALB), tumor marker glypican-3 (GPC3), and HBV-RNA levels.

